
Index 47
CONTINUITY_TESTER
Published:2009/7/10 4:23:00 Author:May
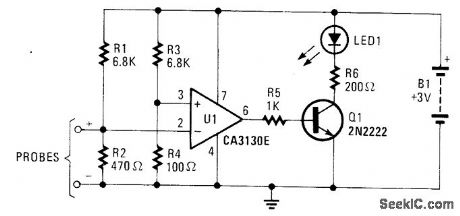
Using a comparator, this continuity tester applies only about 300mV to the circuit to be tested. This avoids false readings in semiconductor circuits. (View)
View full Circuit Diagram | Comments | Reading(0)
MULTIMETER_SHUNT
Published:2009/7/10 4:19:00 Author:May
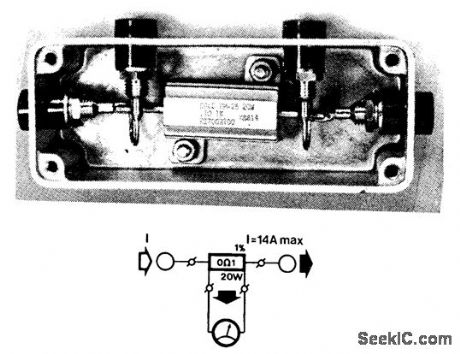
The current range in multimeters, particularly the more inexpensive ones, is restricted by the load limits of the internal shunts to 1 to 2 A. The figure shows how easily a precision heavy-duty resistor from Dale or RCL (0.1Ω;20W;1%) can be used as an external shunt.These resistors were not designed for this purnose, but they are much cheaper than custom-made shunt resistors. The 20-W rating applies only, by the way, if a heatsink is used: without that its rating is only 8W.
The maximum current through the device on a heatsink is about 14A;the larger versions draw up to 17.5A.When mounting the shunt, make sure that the test terminals (as well as the device terminals) are soldered properly, otherwise the resistance of the terminals is added to the shunt. (View)
View full Circuit Diagram | Comments | Reading(871)
OP_AMP_PEAK_DETECTOR
Published:2009/7/10 4:17:00 Author:May
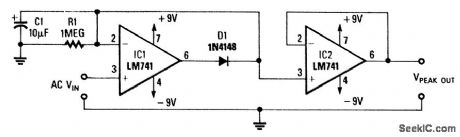
The output ofthis circuit will be a voltage that is equal to the peak of the input. D1 and C1 detect thepeak voltage and this is read by the IC2 voltage follower. (View)
View full Circuit Diagram | Comments | Reading(1430)
4_RANGE_dc_MICROAMMETER
Published:2009/7/10 4:16:00 Author:May
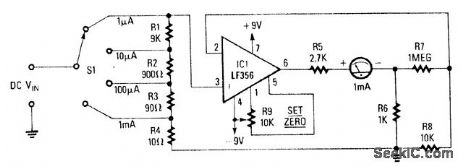
IC1 produces a full-scale reading on M1 when pin 3 has a 10m Vdc level on it, as determined by R7 and R8. R1 through R4 are shunts that produce a 10-mV drop for the desired full-scale range. R9 zeros the meter. (View)
View full Circuit Diagram | Comments | Reading(1616)
FIVE_RANGES_UP_T0_1_μF
Published:2009/7/10 4:16:00 Author:May
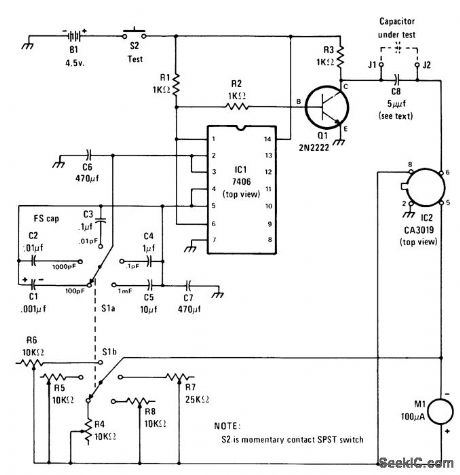
Direct-reading meter gives capacitance values in five ranges, all using same 0-100 scale on 100-μA meter.Operates from three penlight cells. To calibrate, connect known capacitor to jack, close S2, and adiusttrimmer potfor each rangein turn to give correct indication of capacitor value on meter.-C. Green, Build This Easy Capacitor Meter, Modem Electronics, Aug. 1978, p 78-79. (View)
View full Circuit Diagram | Comments | Reading(849)
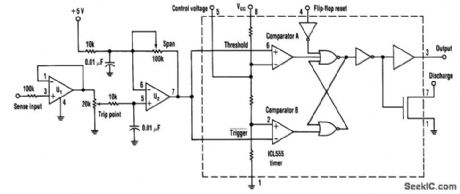
DUTY_CYCLE_DETECTOR
Published:2009/7/10 4:15:00 Author:May
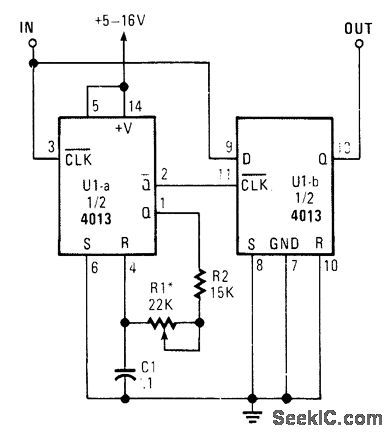
This circuit looks at the time an incoming pulse is high. If the incoming pulse is shorter than the adjusted (VAR1) pulse, the output of U1B is high. Values are shown for a 1-to 2-μs pulse. (View)
View full Circuit Diagram | Comments | Reading(1024)
AIR_PRESSURE_CHANGE_DETECTOR
Published:2009/7/10 4:15:00 Author:May
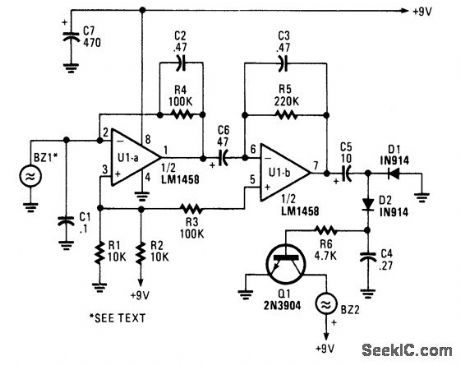
A piezoelectric detector (BZ1) is used in this circuit to detect a change in air pressure. BZ1 produces a voltage that is amplified by U1A and UlB. Frequency response is limited to low frequencies. The signal is rectified by D1 and D2 and drives Q1, which activates BZ2, a piezoelectric buzzer. (View)
View full Circuit Diagram | Comments | Reading(1024)
PEAK_DETECTOR_1
Published:2009/7/10 4:12:00 Author:May
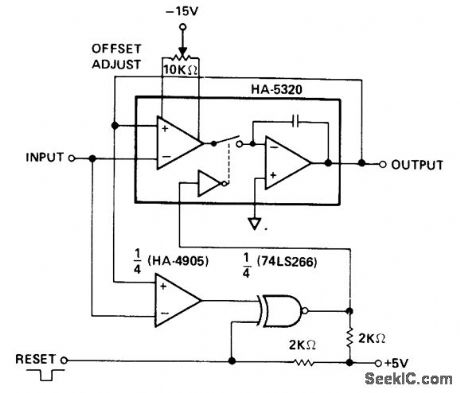
An analog signal requires about 100 ns to prop-OUTPUT agate through the HA-5320. For time-varying signals, this assures a voltage difference between input and output. Also, the voltage changes polarity when the signal slope changes polarity (passes a peak). This behavior makes the circuit a possible sample/hold peak detector, by adding a comparator to detect the polarity changes.
The exclusive NOR gate allows a reset function which forces the HA-5320 to the sample mode. The connections shown detect positive peaks; the comparator inputs can be reversed to detect negative peaks. Also, the offset must be introduced to provide enough step in voltage to trip the comparator after passing a peak. This circuit works well from below 100 Hz up to the frequency at which slew-rate limiting occurs. It captures the amplitude of voltage pulses, provided that the pulse duration is sufftcient to slew to the top of the pulse. (View)
View full Circuit Diagram | Comments | Reading(1109)
SCR_POWER_MONITOR
Published:2009/7/10 4:10:00 Author:May
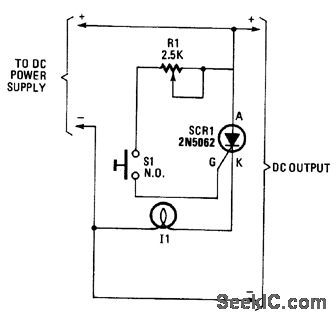
Pressing R1 lights I1, which will extinguish if there has been a power failure. (View)
View full Circuit Diagram | Comments | Reading(814)
HIGH_RESISTANCE_MEASURING_DMM
Published:2009/7/10 4:09:00 Author:May
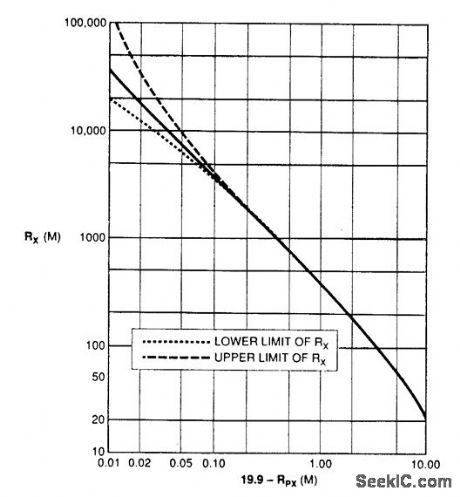
Using a simple technique, you can extend the resistance-measurement range of your 31/2-digit DMM from the usual 19.99 MΩ to 40 GΩ. You could measure, for example, the leakage resis-tances of transformers, motor windings, and capacitors.
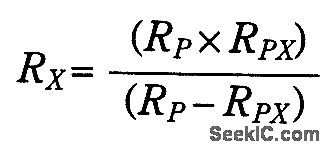
For a 19.99-MΩ DMM range, select a stable 20-MΩ resistor whose value is slightly below nomi-nal, 19.99 MΩ for example. An unknown high resistance, RX,is:
where Rp is the high-value parallel resistor and RpX is the measured value of Rp in parallel with RX. An even easier way to determine the value of Rx is to use the graph. (View)
View full Circuit Diagram | Comments | Reading(916)
IC_PRODUCT_DETECTORS
Published:2009/7/10 4:06:00 Author:May
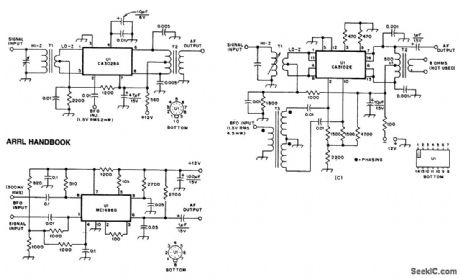
These product detectors use IC devices. SSB and CW signals can be detected with them. The circuits should be useful up to 20 or 30 MHz. T3 in (c) is a 1:1:1 toroidal type, depending on the BF0 frequency. (View)
View full Circuit Diagram | Comments | Reading(1521)
1_99900_μF
Published:2009/7/10 4:05:00 Author:May
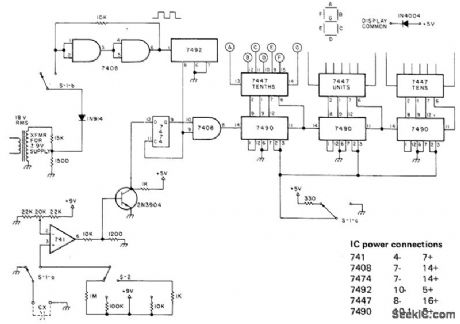
Circuit converts charging time of unknown capacitor to capacitance value shown on 3-digit display. S-1 is shown in OFF position, with unknown capacitor shorted. When S-1 is changed to other position for start of test, Cx is connected to measuring circuit through range switch S-2 and 741 opamp used as comparator. 60-Hz timing waveform is now applied to sinewave squaring circuit using two sections of 7408 AND gate. This starts 7490 counters. Zener-regulated +9 V is applied to Cx through selected range resistor .When charging voltage of capacitor exceeds reference voltage on inverting input, 741 output goes positive andstops counter, Article describes circuit operation in detail. Range switch glves scaling factors of 1,10,100,and 1000.-A,s Joffe,Now-aDigital Capacity Meter!, 73 Magazine, May1978,p 58-60. (View)
View full Circuit Diagram | Comments | Reading(1666)
4_RANGE_ac_MILLIVOLTMETER
Published:2009/7/10 3:47:00 Author:May
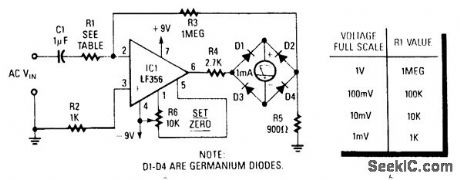
By placing the rectifter in the op amp feedback path, nonlinearity is greatly reduced to insigniftcant levels.The meter will read the full-wave rectifted average (absolute value) of the input signal.Frequency response is a few Hz to about 50 kHz. (View)
View full Circuit Diagram | Comments | Reading(1195)
AM_ENVELOPE_DETECTOR
Published:2009/7/10 3:47:00 Author:May

This general-purpose detector for AM enve-lope detection can be used in many receiver appli-cations. T1 matches the IF amplifier impedance (typically 1 to10 kΩ) to the 1 kΩ (approximately) detector impedance. Dl can be an IN60, IN82AG, IN270, or a similar type. (View)
View full Circuit Diagram | Comments | Reading(1359)
QUICK_MULTICONDUCTOR_CABLE_TESTER
Published:2009/7/10 3:45:00 Author:May

This circuit can be used to check up to an eight-conductor cable. IC1, a 555 timer, drives decade counter 1C2, a 4017. Each LED should light in sequence. The cable to be tested is connected between PL1 and PL2. If the cable is miswired, the LEDs will light out of sequence. If it is shorted or open, some LEDs will not light. (View)
View full Circuit Diagram | Comments | Reading(1945)
CONTINUITY_TESTER
Published:2009/7/10 3:42:00 Author:May
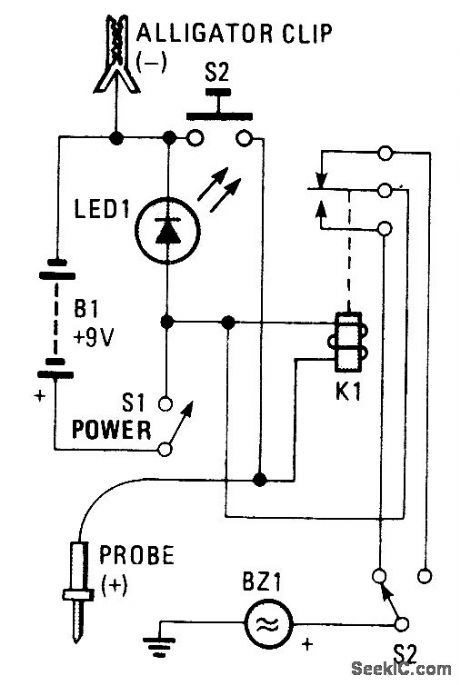
Using an LED and an audible indicator, relay K1 actuates buzzer BZ1. S2 is a buzzer/battery test switch for testing the battery in both NO and NC mode. (View)
View full Circuit Diagram | Comments | Reading(0)
LOW_LEVEL_DIODE_ENVELOPE_DETECTOR
Published:2009/7/10 3:41:00 Author:May
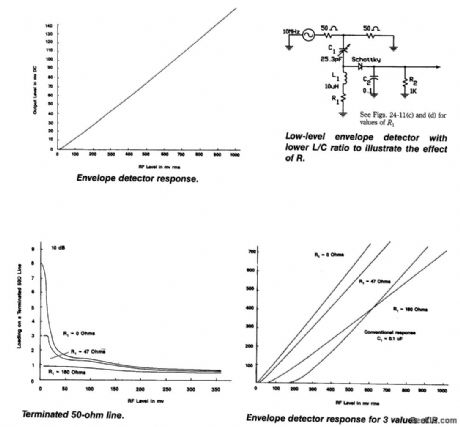
An approach to low-level RF detection and performance curves is shown here. This design is for 10 MHz, but values can be scaled to other frequencies, if needed. (View)
View full Circuit Diagram | Comments | Reading(829)
NOAA_WEATHER_ALERT_DECODER
Published:2009/7/10 3:39:00 Author:May

This circuit detects the 1050-Hz tone sent by the NOAA (National Oceanic and Atmospheric Adminis-tration) Weather radio stations that operate from 162.40 to 162.55 MHz. This tone lasts for several sec-onds. Q1 is an amplifter that feeds tone detector U1, an NE567 detects this tone and produces a low on pin 8. This is coupled to a 555 timer (U3), which produces a high on its pin 3, sounds BZ1, triggers SCR1, and lights the LED. S2 is used to rest the circuit.
Audio is taken from the receiver that is used with the device. S1 is used to test the device and it will sound the alarm in two seconds if all is OK., (View)
View full Circuit Diagram | Comments | Reading(1446)
LINE_OPERATED_SMOKE_DETECTOR
Published:2009/7/10 3:38:00 Author:May
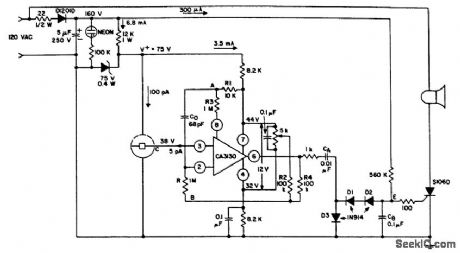
Using an ionization chamber anda high-impedance (CA3130) op amp, the presence of smoke will cause the CA3130 to stop oscillating, triggering S106D SCR, sounding the alarm. (View)
View full Circuit Diagram | Comments | Reading(1103)
DIGTAL_LED_VOLTMETER
Published:2009/7/10 3:37:00 Author:May
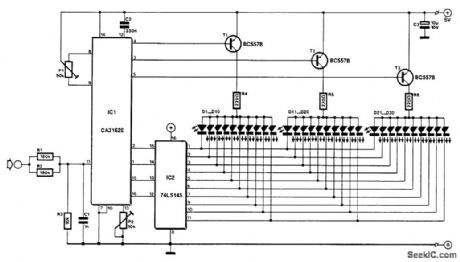
The voltage to be measured is digitized in an analog-to-digital (A/D) converter and then displayed in three decimal digits. The display consists of three groups of 10 LEDs. The meter can only be used for measuring direct voltages.
The A/D converter is based on CA3162, which can process direct voltage up to 999 mV (1-V full-scale deflection-FSD). The FSD is extended to 10 V with the aid of potential divider R1/R2/R3. Other ranges are possible by altering the values of the resistors.
The measured value is read from three bars of LEDs: the first one of these, D1 through D10, shows units; the second, D11 through D20 tens; and the third, D21 through D30, hundreds.
The circuit is nulled with P1 when the input is open. Zero here means that diodes D1 D11, and D21, light. Diodes D10, D20, and D30, represent the figure 9. Next, a known voltage is applied to the input and P2 is adjusted until the LEDs read the correct value. When the input voltage is too high, the display goes out. When the input is negative, the unit LEDs do not light. Notice that variations in the supply voltage affect the measurement adversely. (View)
View full Circuit Diagram | Comments | Reading(2709)
| Pages:47/101 At 204142434445464748495051525354555657585960Under 20 |
Circuit Categories
power supply circuit
Amplifier Circuit
Basic Circuit
LED and Light Circuit
Sensor Circuit
Signal Processing
Electrical Equipment Circuit
Control Circuit
Remote Control Circuit
A/D-D/A Converter Circuit
Audio Circuit
Measuring and Test Circuit
Communication Circuit
Computer-Related Circuit
555 Circuit
Automotive Circuit
Repairing Circuit