
Index 51
GELGER_COUNTER
Published:2009/7/9 21:52:00 Author:May
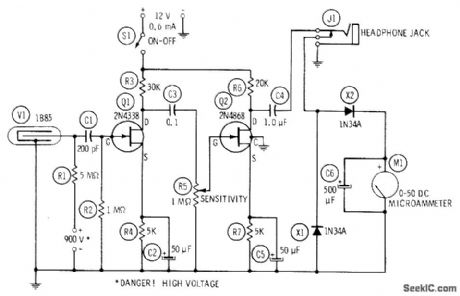
Output signal of Victoreen 1B85 G-M tube biased at 900 VDC is proportional to beta-gamma particle count. Signal is amplified by high-gain AF amplifier Q1-Q2 for driving AC meter circuit. Closed-circuit lack is provided for alternate use of headphones.Count-rate range of instrument is determined by exposing G-M tube to different calibrated radioactive samples and marking meter scale for each. Bias for counter can be obtained from three 300-V photoflashbatteries in series or equivalent supply capable of providing up to 10 mA.-R. P. Turner, FET Circuits, Howard W.Sams, Indianapolis, IN, 1977, 2nd Ed., p 152-153. (View)
View full Circuit Diagram | Comments | Reading(1434)
UHF_MOVEMENT_DETECTOR
Published:2009/7/9 21:26:00 Author:May


The oscillator is a standard UHF design which delivers about 10 mW at 1.2 GHz. R1 and R2 bias the base of Q1 to 1.2 V via L2. Collector current is set by R3 to about 30 mA. C2 couples the base of Q1 to the stripline circuit. Tuning is provided by CV1, and C1 plus C1a decouple the collector. R2 and R3 are not decoupled, since this could cause instability.Q2 is a simple one-transistor amplifier. C4 and C7 reduce gain below 1.5 and above 100 Hz; the remaining band of frequencies is amplified and passed on to the level detector. Two comparators of IC1 provide level detection. The trigger voltage is set by R7, Rv1, R8, and R9; it is adjustable from 8 to 60 mV by Rv1.Positive voltage swings above the trigger level cause the IC1a output to become low, while negative swings cause IC1b to become low. C8 decouples IC1 from the power supply, and R10 is a pull-up resistor for the open collector output of IC1.
(View)
View full Circuit Diagram | Comments | Reading(1226)
LINE_VOLTAGE_MONITOR
Published:2009/7/9 21:16:00 Author:May

This circuit uses a type 741 op amp as a voltage comparator. One input of the 741 is connected to a reference voltage (a 12-V battery) through a resistor voltage divider. The potential at the noninverting input of the 741 is approximately 3 V. The inverting input of the op amp comparator is connected to the output of a line-operated 8-V power supply. When the ac power main fails, T1 will no longer be energized, so the charge stored in capacitor C1 will begin to discharge through resistor R5. When the capacitor voltage drops below the reference voltage of 3 V, the output of the comparator becomes high. This output condition will forward bias transistor Q1, causing the Sonalert to sound the alarm. The time constant of the R5/C1 combination is 22 seconds-long enough to prevent noise from triggering the alarm. (View)
View full Circuit Diagram | Comments | Reading(2733)
AC_POWER_LINE_CONNECTIONS_MONITOR
Published:2009/7/9 21:14:00 Author:May
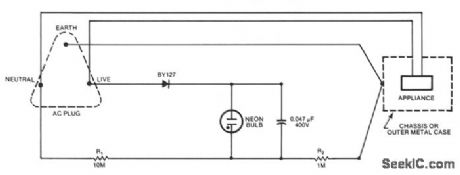
A continuous glow signiftes that everything is normal; a blinking or extinguished neon bulb indicates a broken earth-ground connection, or interchanged neutral and live wires. (View)
View full Circuit Diagram | Comments | Reading(917)
NICAD_BATTERY_TESTER
Published:2009/7/9 21:08:00 Author:May
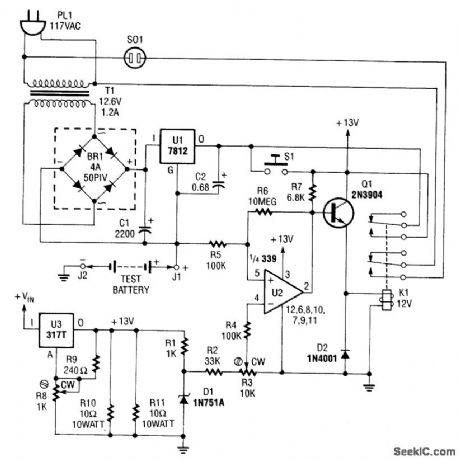
This Nicad battery tester discharges the test battery at a rate of 500 mA.When the endpoint of 1 V(determined by setting of R3) is resolved,pin 2 of U2 becomes low, deactivating Q1 and disconnecting thetest battery from the circuit, Power for U3 comes from the 12-V regulator h series with the battery beingtested, A clock or timer can be plugged into S1 to indicate the time it takes to discharge the battery undertest. (View)
View full Circuit Diagram | Comments | Reading(1062)
BATTERY_TESTER
Published:2009/7/9 21:03:00 Author:May
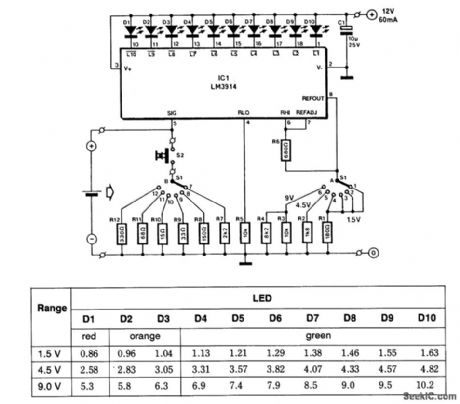
This battery tester makes use of an LM3914 bar-graph driver IC. S1 selects load on battery under test and programs the voltage range. S2 loads the battery under test. The table gives the calibration factors for the tester. LEDs D1 through D10 are used as indicators. (View)
View full Circuit Diagram | Comments | Reading(4618)
INFRARED_REMOTE_CONTROL_TESTER
Published:2009/7/9 21:02:00 Author:May

Using a battery, a phototransistor and a visible-light LED, this simple circuit is a go/no go tester for IR remote control devices. The illumination of the LED indicates that Q1 is being modulated by IR energy. (View)
View full Circuit Diagram | Comments | Reading(0)
FLOW_METER
Published:2009/7/9 21:00:00 Author:May
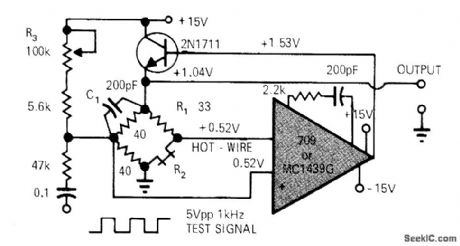
Simple opamp circuit with one transistor gives reliable hot-wire anemometer for measuring flow of gases or liquids. R2 is heated above ambient temperature in Wheatstone bridge including overheat resistor R1which is calibrated to be 30% larger than cold resistance of R2. Bridge is fed from power tran.sistor which is within feedback loop of opamp that senses bridge unbalance. Output of bridge is fed back to power transistor in correct phase for maintaining constant- temperature condition in which R2 is approximately equal to R1. Article covers construction of hot-wire probe made from Wollaston wire.-W. Bank, Build Your Own Constant-Temperature Hot-Wire Anemometer, EDN Magazine, Aug. 1, 1972, p 43. (View)
View full Circuit Diagram | Comments | Reading(4848)
pH_PROBE_AND_DETECTOR
Published:2009/7/9 20:50:00 Author:May
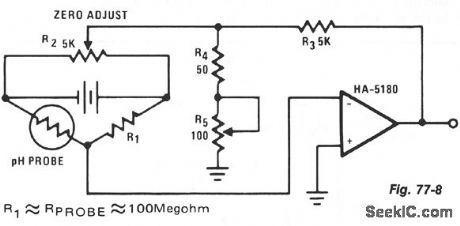
The greatest sensitivityis achieved if R1 is approximately equal to the probe resistance.The circuitcan be zeroed with R2,while the full-scale voltage is controlled by R5. The correlation between pH andoutput voltage might not be linear, which would necessitate a shaping circuit. A calibration scheme, using solutions of known pH, might prove adequate and more reliable over a period of time because of probe vanance. (View)
View full Circuit Diagram | Comments | Reading(983)
INTERNAL_RESISTANCE_BATTERY_TESTER
Published:2009/7/9 20:42:00 Author:May

A designer often needs to know the value of the internal resistance of a battery. Quite a few testers give a relative indication of the value, but this is seldom in ohms. The present tester can, in principle, provide that information.
The basic idea behind it is to load the battery with a varying current, so as to cause an alternatingvoltage drop across the internal resistance that can be measured at the battery terminals. Provided that current variations are regular and constant, the voltage drop is directly proportional to the internal resistance.
Choose the variation of the current carefully to read the value of the internal resistance directly on the scale of an ac voltmeter.
The load current is varied with the aid of a current source, T1 in the diagram, which is switched on and off by square-wave generator IC1. The chosen switching frequency of 50 Hz ensures that the ac component at the battery terminals can be measured by a standard ac voltmeter (universal meter).
The battery is loaded constantly by R8, which has a value of 1.5Ω for 1.5-V batteries, shunted by the ac voltmeter. The indicated voltage times 10 is the value of the internal resistance of the battery. When the battery under test is flat or if the supply battery is flat, no current flows and the meter will read zero. It would then appear as if the battery under test is an ideal type-without internal resistance.
A flat supply battery is indicated if Dl does not light. You can ascertain that the battery under test is flat by measuring the direct voltage across its terminals. The load must be left connected, of course, oth-erwise the emf is measured and this may well be 1.5 V-even if the battery is flat.
The tester is calibrated with the aid of the auxiliary circuit (shown at the extreme right in the circuit diagram). The 1.5-V supply and electrolytic capacitor form a virtually ideal voltage source, of which the 3.9-Ω resistor forms the internal resistance. With this source connected across the output terminals of the tester, a suitable value should be ascertained for R7. That value is found when the ac voltmeter shows 0.39 V. Notice that this procedure is not the same for all measuring instruments: the alternate use of the digital and a moving coil meter, for instance, is not feasible.
The tester is intended for 1.5-V batteries. The load current is fairly high: about 100 mA through R8 and around 170 mA through T1. For 9-V batteries that current is too high: the current should then be reduced by taking greater values for R6 through R8.
(View)
View full Circuit Diagram | Comments | Reading(2690)
SENSITIVE_LOW_CURRENT_DRAIN_MOTION_DETECTOR
Published:2009/7/9 20:31:00 Author:May


This highly sensitive movement detector is designed from bipolar transistors and draws a current of only 0.3 mA during quiescent operation. It is intended primarily as a protection device, but it can also be used in certain games.The principle is simple: a magnet is suspended by a thin thread 20 to 30 mm long, and a few millime-ters above the coil of a relay (whose contacts are not used). Even a minute movement of the protectedobject will disturb the magnet. The resulting changes in the magnetic field above the relay coil will induce a tiny varying voltage across the coil.The first stage consists of a common emitter design with automatic regulation. The collector resistors and the resistors in the regulation bridge have unusually high values.Feedback from the bridge ensures stability of operation for T1. Each increase in collector voltage will be opposed by an increase in base-emitter current. Conversely, each reduction in collector voltage will be opposed by a decrease in base-emitter current. Consequently, the collector voltage will stabilize at a value that corresponds to a base voltage of about 0.6 V. Capacitor C1 delays the immediate effect of the feed-back when the collector voltage changes rapidly.The small varying voltage induced in the relay con is magnified appreciably by T1 because C1 prevents automatic regulation. The output impedance of the first stage is very high, which is, of course, the price to be paid for low consumption. It would not make sense to follow this stage by one with a low output impedance, because this would adversely affect the overall amplification. Because of that, T1 is followed by an emitter-follower, T2, which provides the coupling between T1 and T3. Resistor R5 allows a partial discharge of C2 if T2 is switched off by a reduction in the output of T1. Because this resistor, as a result of the low-consump-tion requirement, has a high value, the circuit will attain its maximum sensitivity 10 seconds after the last movement detection. This is the time that is required for the charge on capacitor C2 to stabilize.The detection proper is carried out by T4, which switches on when the voltage variations in the ampli-fier, passed on by C4, reach a level of 0.6 V. Saturating T4 leads to the instant charging of C5. This capaci-tor will discharge partly via R10 and R11 to the base of T5 when T4 switches off again. When C5 dis-charges, T5 is on, which will make T6 conduct. This in turn will actuate a load, for instance, a buzzer, in the collector circuit of T6.The sensitivity of the detector depends to a large extent on the distance between the magnet and relay and the length of the pendulum. If the circuit is powered by a battery, there is a little problem: batteries have large internal resistances.Thus, a supply voltage can vary by some tenths of a volt if a sudden, large current is drawn. If the buzzer has stopped after a detection, such a situation can retrigger the circuit and cause undesired oscillations. To prevent this happening, the supply of the amplifier stage is decoupled by R3 and C6. (View)
View full Circuit Diagram | Comments | Reading(927)
SINGLE_SUPPLY_FAULT_MONITOR
Published:2009/7/9 20:30:00 Author:May

This circuit shows a typical over/under-voltage fault monitor for a single supply. The upper trip points, controlling OUT 1, are centered on 5.5 V with 100 mV of hysteresis (VU = 5.55 V, VL =5.45 V); and the lower trip points, controlling OUT 2, are centered on 4.5 V, also with 100 mV of hysteresis. OUT 1 and OUT 2 are connected together in a wired OR configuration to generate a power Ok signal. (View)
View full Circuit Diagram | Comments | Reading(0)
LINEAR_LIGHT_METER
Published:2009/7/9 5:35:00 Author:May
Uses Radio Shack 276-115 selenium solar cell or equivalent photocell with high-gain RS741C opamp to drive meter.Sensitivity is sufficient to detect individual stars at night without magnifying lens if photocell is shielded from ambient light with length of cardboard tubing. Increasing value of R1 increases gain and sensitivity of circuit. R2 sets meter needle to zero when sensor is dark.- F. M Mints, Integrated Circuit Projects, Vol. 4, Radio Shack, Fort Worth, TX, 1977, 2nd Ed., p 45-53. (View)
View full Circuit Diagram | Comments | Reading(1305)
STEREO_LED_VU_METER
Published:2009/7/9 4:59:00 Author:May
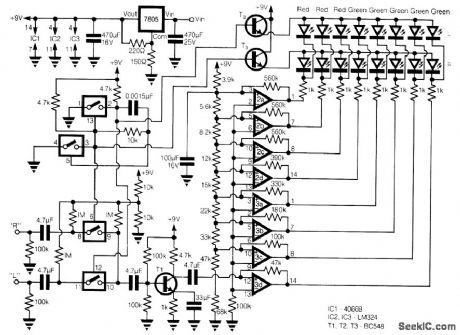
This circuit provides a cheap alternative to the LM3915 series LED displays. The meter relies on a square-wave oscillator built around two CMOS analog switches, which alternatively selects the right and left channels for monitoring and display. The selected signal is amplifted by the common-emitter stage T1, and the output is fed into the string comparators which control the display.
These eight comparators are from two LM324 quad op amps, each is connected to a resistor network, which has a 3dB step between each comparator. Each comparator has a positive feedback resistor to increase the hysteresis to provide a longer display, which is switched altematively at about 10 kHz.
The two CMOS switches in line are biased at half the supply voltage by 1-MΩ resistors from a 100-kΩ divider, which allows them to handle analog signals up to 9 V peak to peak. As the voltage increases above the setpoint of each comparator, the output goes low and the corresponding LED lights, which produces a bar of light in response to the input voltage. For a linear response the resistor-network can be replaced by nine 10-kΩ resistors, giving an equal voltage gap before each LED comes on. (View)
View full Circuit Diagram | Comments | Reading(2277)
DIGITAL_pH_METER
Published:2009/7/9 4:52:00 Author:May
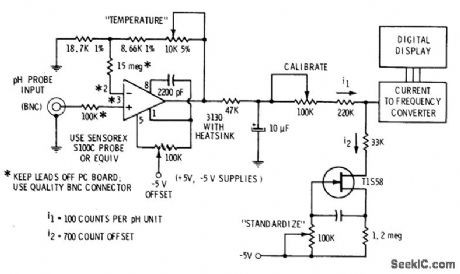
3130 CMOS opamp gives required high input impedance for pH probe at low cost. Output of probe, ranging from positive generated DC voltage for low pH to 0 V for pH 7 and negative voltages for high pH values, is amplified in circuit that provides gain adjustment to correct for temperature of solution being measured. For analog reading, output of opamp can be fed directly to center-scale milliammeter through 100K calibrating pot. For digital display giving reading of 7.00 for 0-V output, pH output is converted to calibrated current for summing with stable offset current equal to 700 counts. This is fed to current-to-frequency converter driving suitable digital display. Standard pH buffer solutions are used for calibration.-D. Lancaster, CMOS Cookbook, Howard W. Sams, Indianapolis, IN, 1977, p 347-349. (View)
View full Circuit Diagram | Comments | Reading(3082)
SIMPLE_LIE_DETECTOR
Published:2009/7/9 4:48:00 Author:May
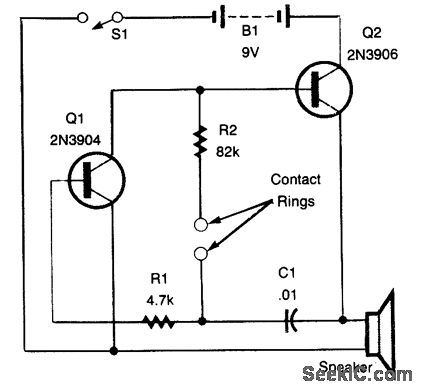
The variation in skin resistance of the subject is used to vary contact rings are two brass rings, about 3/4 ID. (View)
View full Circuit Diagram | Comments | Reading(0)
FREQUENCY_RATIO_MONITORING_CIRCUIT
Published:2009/7/9 4:15:00 Author:May
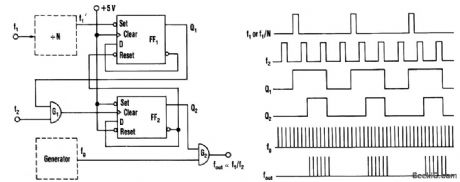
This circuit produces an output frequency that is linearly proportionj to the ratio oftwo input frequen-cies fl/f2.Each pulse of the bias f1(or f)will open G1 for a period T=1/f2 so that fg/f2, pulses pass to the output. (View)
View full Circuit Diagram | Comments | Reading(771)
SIX_RANGE_LIGHT_METER
Published:2009/7/9 4:15:00 Author:May
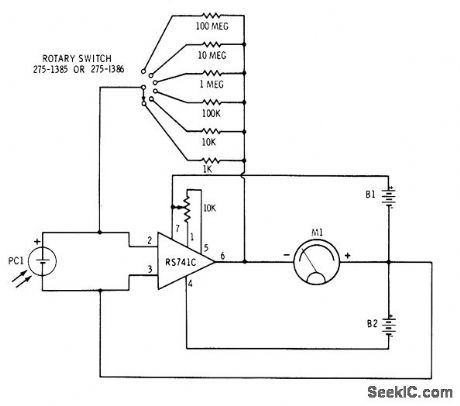
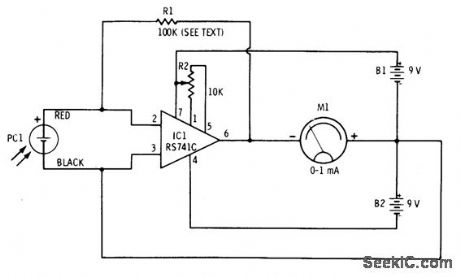
Switching of feedback resistors for opamp driven by Radio Shack 276-115 selenium solar cell gives multirange linear light meter. With 1000-megohm resistor for highest sensitivity, star Sirius will produce pho-tocurrent of about 25 pA when aolar cell is shielded from ambient light with length of cardboard tubing. Supplies are 9 V, and meter is 0-1 mA.-F. M. Mims, Integrated Circuit Projects, Vol. 4, Radio Shack, Fort Worth, TX, 1977, 2nd Ed., p 45-53. (View)
View full Circuit Diagram | Comments | Reading(3466)
ANALOG_EXPANDED_SCALE_METER_FOR_AUTOS
Published:2009/7/9 3:52:00 Author:May
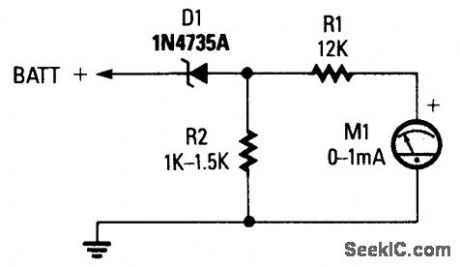
Zener diode D1 is used to suppress the ftrst 6 V of the scale, which gives a meter reading of 6 to 8 V-useful for automotive electrical system monitoring. (View)
View full Circuit Diagram | Comments | Reading(752)
AUTOMOTIVE_ELECTRICAL_TESTER
Published:2009/7/9 3:45:00 Author:May
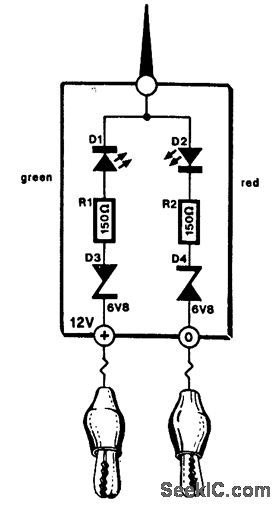
This little tester is useful for checking vehicle electrical circuits. Two LEDs indicate whether one of the clips is connected to the positive supply line (red) or to ground (green).
The unit is powered by the vehicle battery. It is advisable to terminate the unit into two insulated heavy-duty crocodile clips. These enable connection to be made directly to the battery or to terminals on the fuse box.It is also possible to terminate it into a suitable connector that fits into the cigarette lighter socket. If a sharp needle is soldered to one of the terminals, it is possible to check insulated wiring-but only those that carry 12 V.
Although the needle pierces the insulation, it does not damage it. (View)
View full Circuit Diagram | Comments | Reading(1155)
| Pages:51/101 At 204142434445464748495051525354555657585960Under 20 |
Circuit Categories
power supply circuit
Amplifier Circuit
Basic Circuit
LED and Light Circuit
Sensor Circuit
Signal Processing
Electrical Equipment Circuit
Control Circuit
Remote Control Circuit
A/D-D/A Converter Circuit
Audio Circuit
Measuring and Test Circuit
Communication Circuit
Computer-Related Circuit
555 Circuit
Automotive Circuit
Repairing Circuit