
Index 58
COPROCESSOR_SOCKET_DEBUGGER
Published:2009/7/7 3:17:00 Author:May
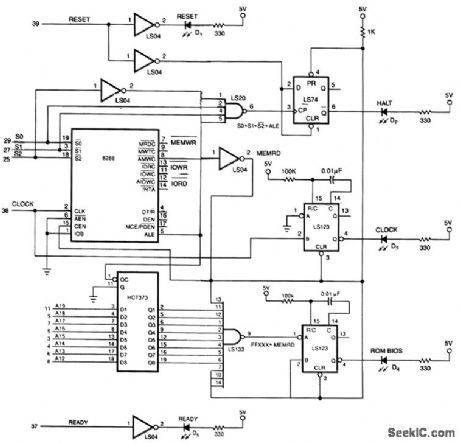
The IBM PC debugger plugs into the PC's math-coprocessor socket.The 8288 bus controller, IC1, regenerates control signals from the processor's status signals, S0, S1, and S2. Reset LED D1 lights if reset is active and holding the processor. Clock status LED D3 indicates that the processor is receiving a toggling clock signal. The address-decode logic detects when the processor is doing a jump-on-reset to the PC's BIOS ROM's power-on; self-test then detects a fatal error and halts the processor.
(View)
View full Circuit Diagram | Comments | Reading(1208)
10_W_ON_2_METERS
Published:2009/7/7 2:41:00 Author:May
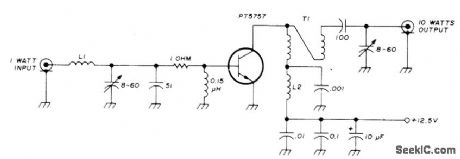
Single TRW PT5757 transistor provides 10-W output when operating from 12.5-V auto battery. L1 is 4 tums No. 20 enamel and L2 is 10 tums No. 20, both with 3/32inch inner diameter. T1 is 4:1 transmission-line transformer made from 3-inch length of twisted-pair No. 20 enameL-J. Fisk, Two-Meter Power Amplifier, Ham Radio, Jan. 1974, p 67. (View)
View full Circuit Diagram | Comments | Reading(802)
MULTIPLEINPUT_DETECTOR
Published:2009/7/7 2:38:00 Author:May
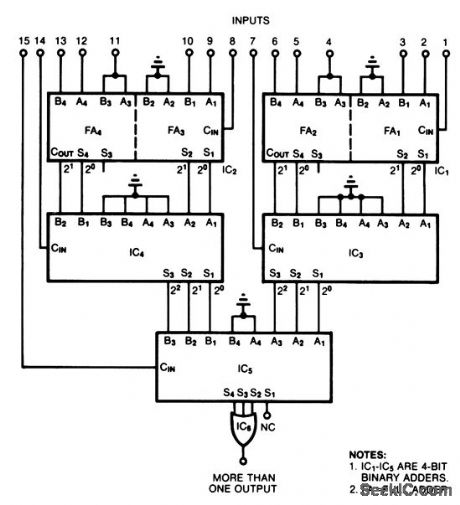
This circuit determines whether more than one input in a group of digital inputs is active. It provides a digital measure of the number of active inputs, and it allows you to establish a threshold for majority-decision applications. That is, whether the number of active inputs is more than, less than, or equal to a value between 1 and 15. You can monitor more inputs by cascading the adders.
Each binary adder, IC1 and IC2, forms two full adders (FAs). Each FA monitors three input lines and generates a 2-bit output representing the number of inputs active. IC3 and IC4, by summing the outputs of two FAs plus an input line, individually measure how many in a group of seven inputs are active. Similarly, by monitoring the 3-bit outputs of IC3 and IC4 plus one input, IC5 measures how many in the group of 15 are active. The OR gate, IC6, simply indicates whether more than one input is active. (View)
View full Circuit Diagram | Comments | Reading(820)
SOFTWARE_MONITOR
Published:2009/7/6 20:40:00 Author:May
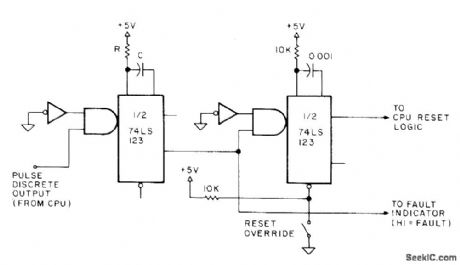
Detects large percent-age of random faults, such as overflow conditions. Based on fact that part of program passes through reentry on predictable repeat basis. For each reentry, pulse is fed from CPU to input of ,, 74LS123 retriggerable mono MVBR. On each pass through program, programmer sets and then resets MVBR. Period of mono is made longer than longest normal time between programmed pulse outputs, to prevent false alarms. Any system fault that makes program repeat instructions endlessly or lose control will give false indication.-D. Brickner, Get a Watch-dog to Monitor Those Real-Time Operations, Kilobaud, April 1978, p 118-119. (View)
View full Circuit Diagram | Comments | Reading(1330)
REMOTE_TELEPHONE_MONITOR
Published:2009/7/6 20:35:00 Author:May
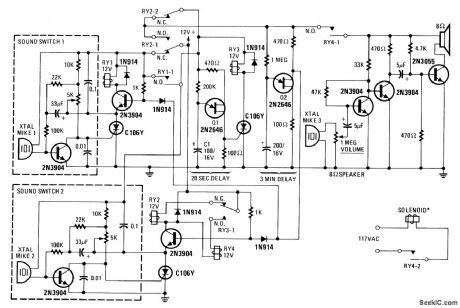
This device monitors sounds in home or office when a telephone is called from a remote location. (View)
View full Circuit Diagram | Comments | Reading(787)
CAPACITANCE_METER
Published:2009/7/6 20:33:00 Author:May
U1a is an oscillator and U1b the measurement part of the circuit. It converts unknown capacity into a pulse-width modulated signal the same way an automotive dwell meter works. The meter is linear so the fraction or percentage of time that the output is high is directly proportional to the unknown capacitance (CX in the schematic). Meter M1 reads the average voltage of those pulses since its mechanical frequency response is low compared to the oscillator frequency of U1a. (View)
View full Circuit Diagram | Comments | Reading(2)
31_2_DIGIT_A_D_CAPACITANCE_METER
Published:2009/7/6 20:30:00 Author:May
The circuit charges and discharges a capacitor at a crystal-controlled rate, and stores on a sample-and-difference amplifier the change in voltage achieved. The current that flows during the discharge cycle is averaged, and ratiometrically measured in the a/d using the voltage change as a reference. Range switching is done by changing the cycle rate and current metering resistor. The cycle rate is synchronized with the conversion rate of the a/d by using the externally divided internal oscillator and the internally divided back plane signals. For convenience in timing, the switching cycle takes 5 counter states, although only four switch configurations are used. Capacitances up to 200 μF can be measured, and the resolution on the lowest range is down to 0.1 pF.
The zero integrator time can be set initially at 1/3 to 1/2, the minimum auto-zero time, but if an optimum adjustment is required, look at the comparator output with a scope under worst-case overload conditions. The output of the delay timer should stay low until after the comparator has come off the rail, and is in the linear region (usually fairly noisy).
(View)
View full Circuit Diagram | Comments | Reading(938)
STEREO_BALANCE_METER
Published:2009/7/6 20:01:00 Author:May
To use the indicator, switch the amplifier to mono mode and adjust the balance control until both LEDs are equally illuminated. The amplifier is now in perfect stereo mode balance. (View)
View full Circuit Diagram | Comments | Reading(0)
STEREO_BALANCE_TESTER
Published:2009/7/6 20:00:00 Author:May

The meter will show volume and tone control balance between left and right stereo amplifiers. For maximum convenience the meter is a zero-center type. Resistors are five percent or better and the diodes a matched pair. Optimum stereo level and phase balance occurs for matched speakers when the meter indicates zero. If the meter indicates either side of zero, the levels are not matched or the wires are incorrectly phased. Check phasing by making certain the meter leads are connected to the amplifier hot terminals and the common leads go to ground. (View)
View full Circuit Diagram | Comments | Reading(977)
LIQUID_LEVEL_MONITOR
Published:2009/7/6 9:31:00 Author:May
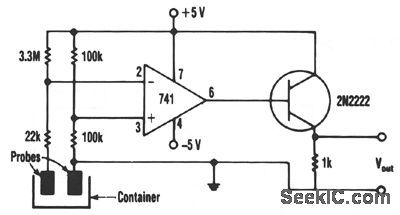
This monitor uses a common 741 amp conft-gured as a comparator and a low cost nontransistor as an output driver. With no liquid detected, a volt-age of about 2.92 V is present in the op amp's inverting input at pin 2. The 100-KΩ resistors establish a reference voltage of +2.5 V at the non-inverting input at pin 3 of the op amp. Under those conditions, the op amp's output is -3.56 V, which keeps the 2N2222 transistor turned off and the voltage across its 1-KΩ output load resistor at 0 V. When liquid reaches the probes, the 3.3-MΩ and 22-KΩ resistor circuit conductively connects to ground. When enough current, about 1.4 μA, flows through the liquid, the small 30 mV drop developed across the 22-KΩ resistor drives the op amp to deliver an output voltage of about 4.42 V. This volt-age then drives a 2N2222 transistor into saturation, which generates a voltage drop of about 3.86 V across its 1-KΩ output load resistor. (View)
View full Circuit Diagram | Comments | Reading(1113)
SOIL_MOISTURE_METER
Published:2009/7/6 9:26:00 Author:May
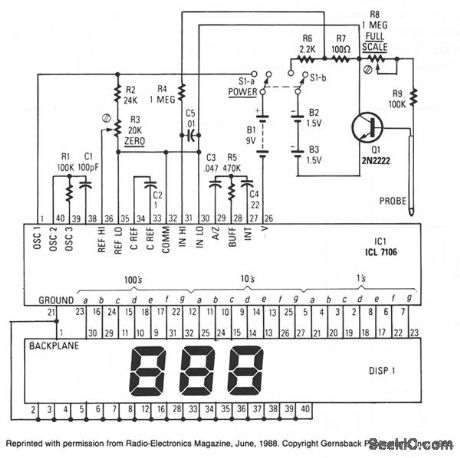
IC1, an Intersil ICL7106, contains an a/d converter, a 3 1/2-digit LCD driver, a clock, a voltage refer-ence, seven segment decoders, and display drivers. A similar part, the ICL7107, can be used to drive seven segment LEDs. The probe body is a five-inch length of light-weight aluminum tubing. The leads from the circuit are connected to the body and tip of the probe. The sensor functions as a variable resistor that varies Q1's base current, hence its collector current. The varying collector current produces a varying voltage across 100 Ω resistor R7, and that voltage is what IC1 converts for display.The LCD consumes about 25 μA, and IC1 consumes under 2 mA, so the circuit will run for a long time when it is powered by a standard 9-V battery. Current drain of the two 1.5-V AA cells is also very low: under 300 μA.To calibrate, rotate R3 to the center of its range. Then place the end of the probe into a glass of water and adjust R8 for a reading of 100. When you remove the probe from the water, the LCD should indicate 000. You might have to adjust R3 slightly for the display to indicate 000. If so, readjust R8 with the probe immersed. Check for a reading of 000 again with probe out of water. (View)
View full Circuit Diagram | Comments | Reading(3789)
DUAL_LIQUID_LEVEL_DETECTOR
Published:2009/7/6 9:23:00 Author:May
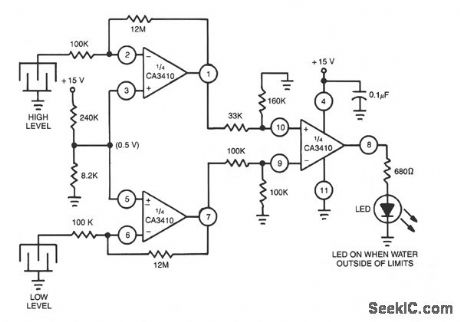
Uses CA3410 quad BiMOS op amp to sense small currents. Because the op amp's input current is low, a current of only 1 μA passing through the sensor will change the converter's output by as much as 10 to 12 V. (View)
View full Circuit Diagram | Comments | Reading(905)
SCR_RING_COUNTER
Published:2009/7/6 8:40:00 Author:May
One lamp at a time is lit in the string to give the appearance of a moving point of light. (View)
View full Circuit Diagram | Comments | Reading(994)
PRECISION_RECTIFIER_WITH_GAIN
Published:2009/7/6 7:01:00 Author:May
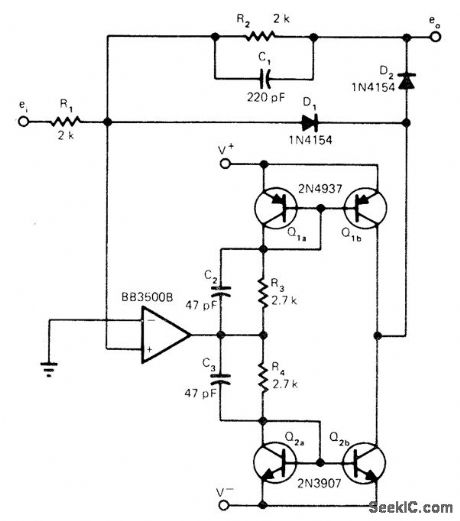
Gain is selectively added during open-loop switching transition of precision rectifier diodes D1 and D2 in feedback loop of opamp, to boost speed while maintaining feedback stability following switching. Q1 andQ2 add gain of about 250 up to 30 kHz during switching, because D1 and D2 are then off and do not shunt output of added stage. Following transition, one of diodes conducts heavily, shunting high output impedance of stage and dropping its gain below unity. Article covers circuit operation in detail-J.Graeme, Boost Precision Rectifier BW above That of Op Amp Used, EDN Magazine, July 5, 1974,p67-69. (View)
View full Circuit Diagram | Comments | Reading(780)
PHASE_ERROR_TESTER
Published:2009/7/6 6:32:00 Author:May
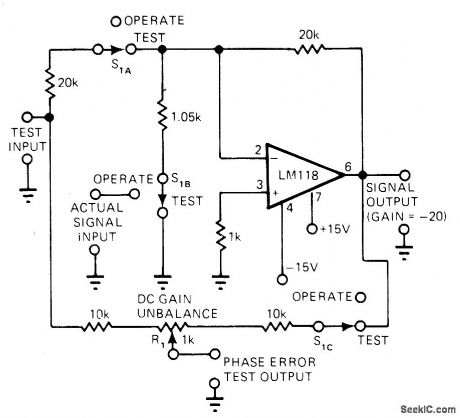
Circuit reveals significant phase errors at relatively low frequencies, even for high-speed opamps. Technique applies to most opamps and almost any signal gain. Article gives operating instructions based on observation of null with XY CRO connected to phase-error test output.-R. A. Pease, Technique Trims Op-Amp Amplifiers for Low Phase Shift, EDN Magazine, Aug. 20, 1977, p 138. (View)
View full Circuit Diagram | Comments | Reading(664)
END_OF_TAPE_DETECTOR
Published:2009/7/6 6:13:00 Author:May
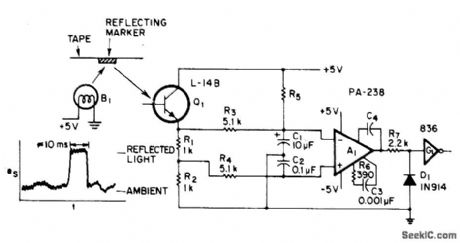
Self-compensating sensor automatically compares short-term light variations produced by beginning and end markers on digital magnetic recording tape against long-term variations of ambient light, to improve reliability of sensing marker when there are reflections from blank tape. Low-pass filter R3-C1, having time constant about 5 times expected 10-ms incoming pulse width, stores long-term light level without reacting to short signal pulse. Low-pass filter R4-C2, having 1/20 time constant of incoming pulse width, reduces spurious noise without deteriorating incoming pulses.-C. A, Herbst, Optical Tape-Marker Detector, EEE Magazine, March 1971, p 79. (View)
View full Circuit Diagram | Comments | Reading(875)
MODULATED_LIGHT_RECEIVER
Published:2009/7/6 6:12:00 Author:May
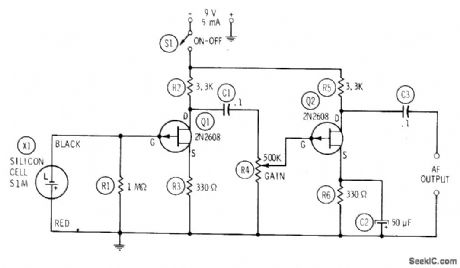
Two FET stages amplify chopped or smoothly modulated output signal of 5-lm/ft2 light beam, Circuit will produce 1 VRMS at output when R4 is set for maximum gain. Can be used for light-beam communication and for alarm systems.-R.P. Turner, “FET Circuits,” Howard W. Sams, Indianapolis, In, 1977, 2nd Ed., p 113-114. (View)
View full Circuit Diagram | Comments | Reading(0)
AUDIBLE_LIGHT_METER
Published:2009/7/6 6:11:00 Author:May
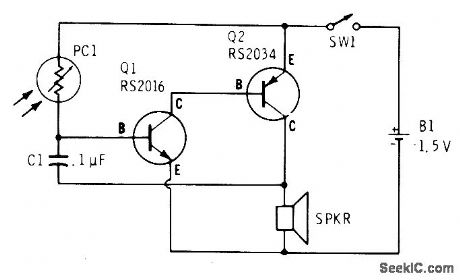
Low light on cadmium sulfide photocell (Radio Shack 276-116) produces series of clicks in miniature 8-ohm loudspeaker. As light increases, clicks merge into audio tone that increases in frequency as light intensity increases. Can be used for classroom demonstrations or as sunrise alarm clock. Circuit is quiet in total darkness.-F. M. Mims, Optoelectronic Projects, Vol. 1, Radio Shack, Fort Worth, TX, 1977, 2nd Ed., p 61-66. (View)
View full Circuit Diagram | Comments | Reading(1863)
LIGHT_CHANGE_DETECTOR
Published:2009/7/6 6:10:00 Author:May
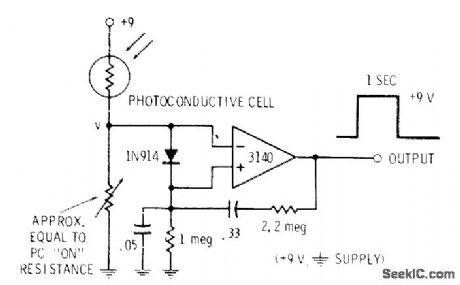
Combination amplifier and detector using 3140 opamp responds only to sudden changes in light on photocell while ignoring slow changes in ambient light. When beam is suddenly broken, opamp output swings positive and stays positive for delay time set by recharging of 0.05-μF capacitor on positive input. Delay locks out spurious signals until photocell resets itself to normal illumination. Values shown give time-out delay of about 1 s, with clean conditioned rectangular output pulse.-D. Lancaster, CMOS Cookbook, Howard W. Sams, Indianapolis, IN, 1977, p 346-347. (View)
View full Circuit Diagram | Comments | Reading(892)
LOW_BATTERY_DETECTOR
Published:2009/7/6 5:39:00 Author:May
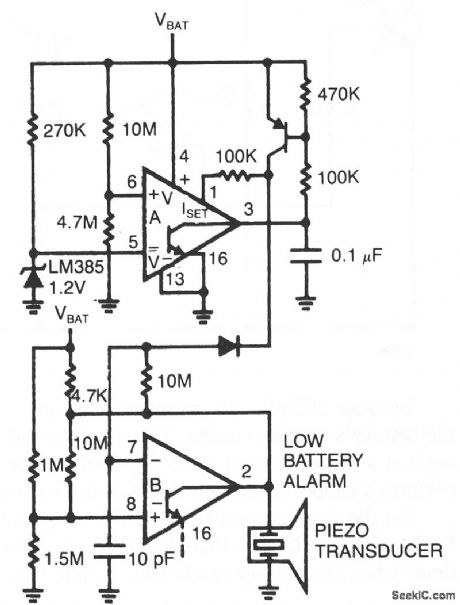
Comparator A detects when the supply voltage drops to 4 V and enables comparator B to drive a piezoelectric alarm. (View)
View full Circuit Diagram | Comments | Reading(2515)
| Pages:58/101 At 204142434445464748495051525354555657585960Under 20 |
Circuit Categories
power supply circuit
Amplifier Circuit
Basic Circuit
LED and Light Circuit
Sensor Circuit
Signal Processing
Electrical Equipment Circuit
Control Circuit
Remote Control Circuit
A/D-D/A Converter Circuit
Audio Circuit
Measuring and Test Circuit
Communication Circuit
Computer-Related Circuit
555 Circuit
Automotive Circuit
Repairing Circuit