
Measuring and Test Circuit
Index 62
SCR_GAS_SMOKE_DETECTOR
Published:2009/7/5 22:28:00 Author:May
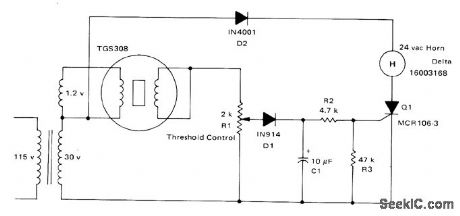
Simple circuit uses Taguchi TGS308 gas sensor with SCR Q1 for half-wave control of 24-VAC alarm horn.Sensor is based on adsorptive and desorptive reaction of gases on tin oxide semiconductor surface encased in noble-metal heater that serves also as electrode. Combustible gases increase conductivity of sensor, thereby increasing load voltage enough to trip comparator and initiate alarm. Output voltage across Rl is normally about 3 VRMS. With gas or smoke, voltage can rise to 20 V. When gas or smoke has cleared sensor, SCR turns off at first zero crossing. Drawbacks are absence of time delay for preventing false alarm when power istumed on and reduced sound level of horn with half-wave operation.-A. Pshaenich, Solid State Gas/Smoke Detector Systems, Motorola, Phoenix, AZ, 1975, AN-735, p 3. (View)
View full Circuit Diagram | Comments | Reading(1199)
NOISE_LIMTER
Published:2009/7/5 22:02:00 Author:May
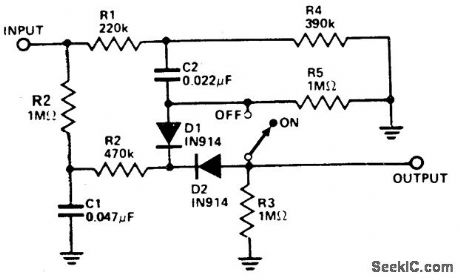
This limiter improves signal-to-noise ratio. It is connected between the detector output and the audio input (if high impedance) or at some relatively high-impedance section between two audio stages-preferably the low level stages. D1 and D2 can be any diode having relatively low forward resistance and very high back resistance. The circuit is excelent for receivers having bandwidths down to 2 or 3 kHz. Increase the value of C1 for receivers having narrower bandwidths. (View)
View full Circuit Diagram | Comments | Reading(926)
DISK_FILE_DECODER
Published:2009/7/5 20:52:00 Author:May
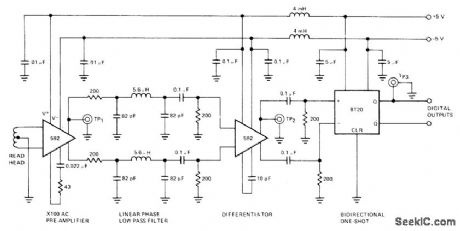
Provides preconditioning of readback data from disk or drum files by using NE592 video amplifier coupled to 8T20 bidirectional mono MVBR through low-pass filter and second 592 serving as low-noise differentiator/amplifier. Mono provides required output pulses at zero-crossing points of differentiator. Designed for reading 5-MHz phase-encoded data.- Signetics Analog DataManual, Signetics, Sunnyvale, CA, 1977, p708-710. (View)
View full Circuit Diagram | Comments | Reading(1428)
Testing high, low frequency transistor circuit diagram
Published:2011/8/1 22:05:00 Author:Ecco | Keyword: Testing circuit, high frequency transistor , low frequency transistor
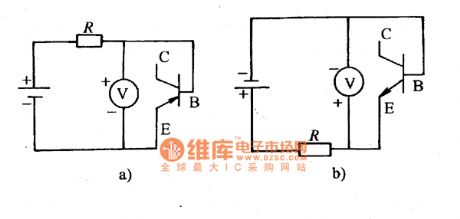
Method: PNP transistor is connected according to the figure a; NPN transistor is connected according to the figure b. In the figure, R is 2OkΩ limiting resistor, and power supply voltage E is l2V, V is the multimeter voltage and current files (it should be allocated the file with slightly larger than l2V).
(View)
View full Circuit Diagram | Comments | Reading(1319)
CRYSTAL_FM_DETECTOR_
Published:2009/7/4 20:17:00 Author:May
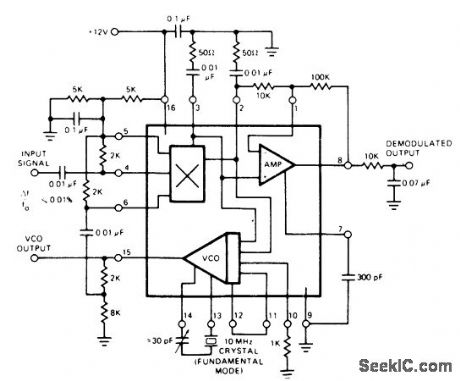
Exar XR-215 PLL IC is operated as crystal-controlled phase-locked loop by using crystal in place of conventional timing capacitor.Crystal should be operated infundamental mode Typical pull-in rangeis±1kHz at l0 MHz.-″Phase-Locked Loop Data Book,'' Exar Integrated Systems,Sunnyvale,CA,1978,p 21-28 (View)
View full Circuit Diagram | Comments | Reading(1045)
DEVIATION_METER
Published:2009/7/4 5:38:00 Author:May
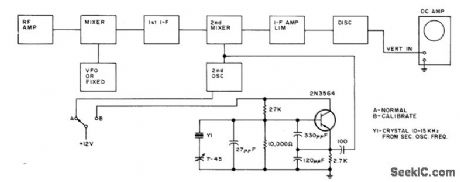
Uses simple crystal oscillator combined with fixed or tunable FM receiver and CRO to show carrier shift on either side of center frequency,Vertical amplifier of CRO should be direct-coupled. To calibrate, tune oscillator either 10 or 15 kHz above or below second oscillator of receiver, and calibrate screen of CR0 accordingly. 0ne calibration oscillatoris sufficient since transmitter usually deviates equally well both ways.-V.Epp,FM Deviation Meters,73 Magazine, March 1973,p 81-83. (View)
View full Circuit Diagram | Comments | Reading(1464)
FM_DETECTOR_
Published:2009/7/3 4:50:00 Author:May
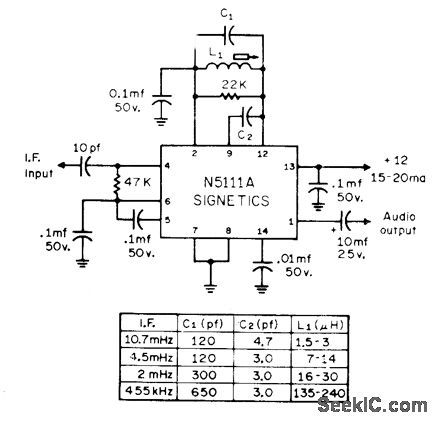
SingLe IC can be added to any receiver not having FM detector. Moving C2 from pin 9 to pin 10 gives higher audio output.Receivers having Less than 5 kHz IF bandwidth can be broadened by stagger-tuning IF strip slightly to improve audio clarity. Adjust tuned circuit of detector for maximum recovered audio.-I. Math, Math's Notes, CQ, June 1972, p 49-51 and 80. (View)
View full Circuit Diagram | Comments | Reading(1026)
Electric and pressure measuring circuit diagram
Published:2011/8/1 21:01:00 Author:Ecco | Keyword: Electric measuring , pressure measuring
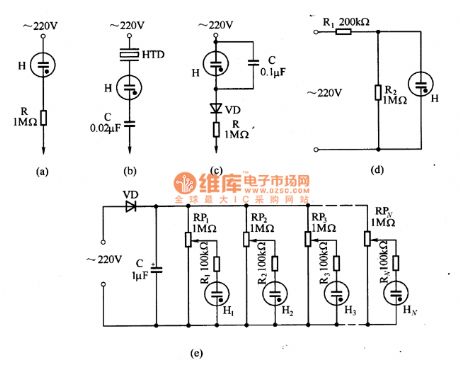
Figure (a) shows the general test pencil circuit; figure (b) shows the sound test circuit; Figure (c) shows the pressure measurement circuit with flashing light; figure (d) is the voltage indication circuit; figure (e) shows the peak voltage indicator circuit, and adjusting the resistance of the potentiometer RP can increase gradually neon starter.
(View)
View full Circuit Diagram | Comments | Reading(971)
SIGLE_TUNED_DETECTOR
Published:2009/7/3 4:27:00 Author:May
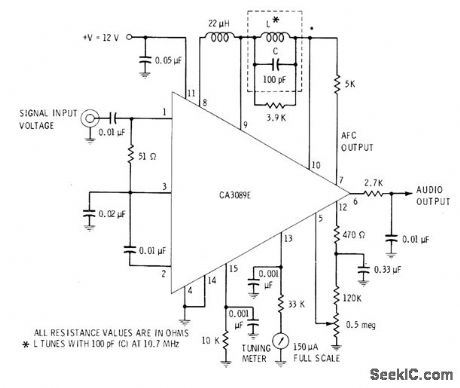
RCA CA3089E IC serves as communication receiver subsystem providing three-stage FM IF amplifier/limiter channel, with signal-level detectors for each stage, and quadrature detector that can be used with single-tuned detector coil. Detector also supplies drive to AFC amplifier whose output can be used to hold local oscillator orl correct frequency. Level-detector stages supply signal for tuning meter. Values shown are for 10.7-MHz IF.-E. M. Noll, Linear IC Principles, Experiments, and Projects, Howard W. Sams, Indianapolis, IN, 1974, P 374-379 (View)
View full Circuit Diagram | Comments | Reading(1859)
HEART_MONITOR
Published:2009/7/3 3:55:00 Author:May
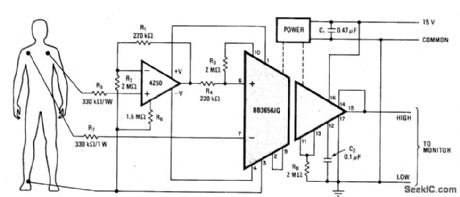
Electrocardiograph amplifier uses Burr-Brown BB3656 isolation amplifier to protect electrocardiograph from inadvertent applications of defibrillation pulses while patient is being monitored. Heart pulses are accurately amplified over frequency range of DC to 3 kHz. Resistors must be carbon-composition types.-B.Olschewski, Unique Transformer Design Shrinks Hybrid Isolation Amplifier's Sizeand Cost.Electronics.July 20.1978.p105-112. (View)
View full Circuit Diagram | Comments | Reading(4112)
BIOELECTRIC_VOLTMETER
Published:2009/7/3 3:36:00 Author:May
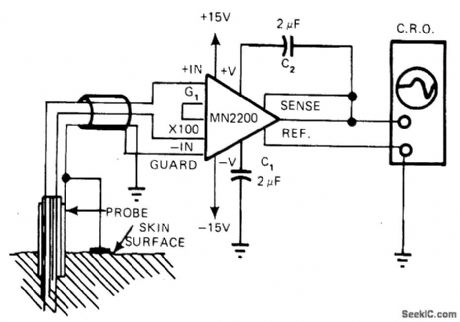
Used to measurebioelectric phenomena involving both DC and waveform characteristics with amplitudes ofabout 10 mV Since electrodes have impedanceof 20,000 to 100,000 ohms、guard terminal mustbe used to drive input shield Bias-current return comes from ground plate on skin.Fixedgain of 1000 gives absolute measure of inputvoltage magnitude.-R,Duris,Instrumentation Amplifiers-They're Great Problem Solvers When correctly Applied,EDN Magazine, Sept5,1977,p 133-135. (View)
View full Circuit Diagram | Comments | Reading(857)
BAR_GRAPH_VOLTMETER
Published:2009/7/3 3:13:00 Author:May
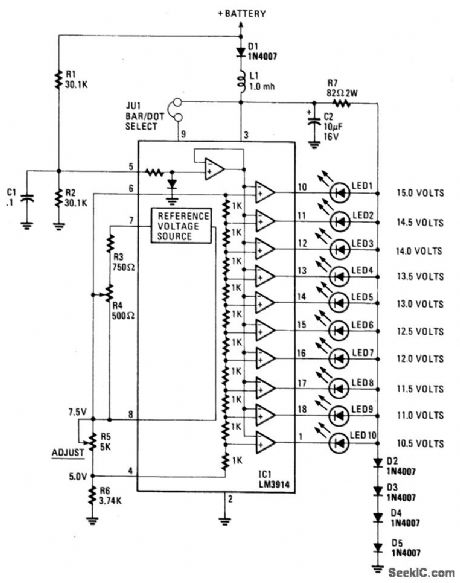
This display uses ten LED's to display a voltage range from 10.5 to 15 volts. Each LED represents a 0.5-volt step in voltage. The heart of the circuit is the LM-3914 dot/bar display driver. Trimmer potentiometer R5 is adjusted so that 7.5 volts is applied to the top side of the divider. Resistor R7 and diodes D2 through D5 clamp the voltage applied to the LED's to about 3 volts. A lowpass filter made up of L1 and C2 guards against voltage spikes. Diode D1 is used to protect against reverse voltage in case the voltmeter is hooked up backward. (View)
View full Circuit Diagram | Comments | Reading(2690)
EKG_TELEMETER
Published:2009/7/3 3:09:00 Author:May
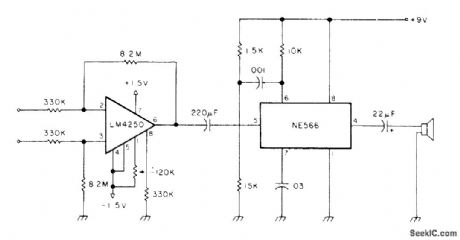
Developed for experimentation or educational demonstrations in which audience listens to electrocardiograph signal voltage as fed through LM4250 opamp for modulating NE566 connected as VCO driving small loudspeaker. Acoustic output can be picked up by microphone for telemetry purposes if desired. Connection to patient can be made with standard adhesive monitoring electrodes or with small metal disks held on wfists with rubber bands. Tone shifts frequency with each pulse beat.-M. I. Leavey, lnexpensive EKG Encoder, 73 Magazine, Feb. 1978, p 20-23. (View)
View full Circuit Diagram | Comments | Reading(2544)
POWER_SUPPLY_MONITOR
Published:2009/7/3 2:50:00 Author:May
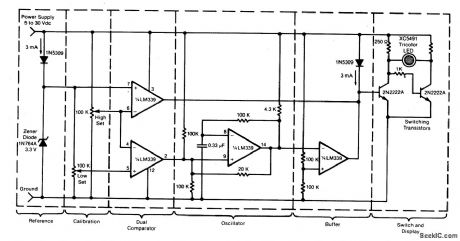
Circuit Notes
This circuit uses a tricolor LED display to indicate acceptable and unacceptable output voltages. One to set the upper voltage limit, the other, the lower voltage limit. When the monitored voltage is above the set maximum, the LED display turns red. Yellow turns on for voltages below the set minimum, and green turns on for voltages between the high and the low settings. The circuit does not need a separate power supply. It is powered by the voltage it monitors.The circuit can be adapted to monitor voltage differences between two power supplies. Should the monitored voltages differ by more than a set value, a visual or an audible alarm would warn the operator about the difference.The circuit can also be modified for remote monitoring and the use of a separate power supply. (View)
View full Circuit Diagram | Comments | Reading(1)
HEART_RATE_MONITOR
Published:2009/7/3 2:45:00 Author:May
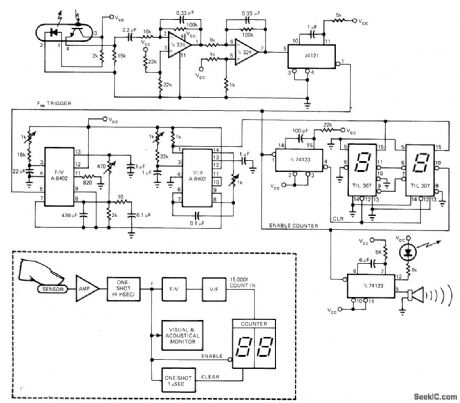
Measures instantaneous frequency of such slow signals as heart beats (1 Hz) or 33-rpm motors (0.5 Hz) by measuring period T and inverting that quantity to obtain f. Operates from single 5-V supply for portable operation. Fast response time gives reading of heartbeat rate on digital display in two or three pulses. Optoisolator serving as sensor can be taped to almost any part of body because it responds to reflectivity changes caused by changing blood pressure,Accuracyis near 1%-G,Timmermann,Heartbeat-RateMonitor Captures VLF Signals.EDN Magazine,Oct,20.1977,p79-80. (View)
View full Circuit Diagram | Comments | Reading(0)
AUDIO_EMG_MONITOR
Published:2009/7/3 2:29:00 Author:May
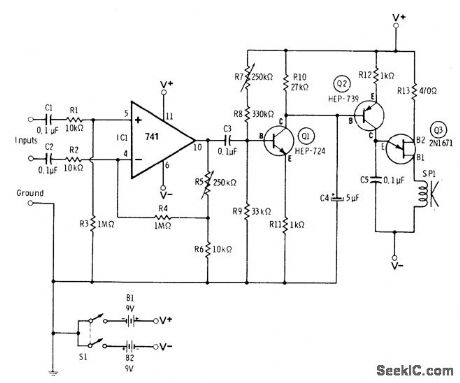
Used to measure very small voltages that appear on surface of skin over body muscle. Instead of recording voltage in form of electromyogram (EMG), opamp drives transistor circuit to produce audible note that varies in pitch as EMG signal varies in amplitude. Applications include use by stroke patient as aid to leaming reuse of muscle group affected by stroke. Q1 rectifies and averages amplified EMG signal. Q2 controls charging current of C5 for varying frequency of UJT oscillator Q3.-R. Melen and H. Garland, Understanding IC Operational Amplifiers, Howard W. Sams, Indianapolis, IN, 2nd Ed., 1978, p 125-127 (View)
View full Circuit Diagram | Comments | Reading(2199)
AURAL_TACTILE_METER_FOR_BLIND
Published:2009/7/3 1:47:00 Author:May
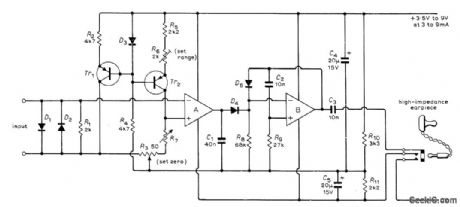
Converts DC input voltage in range of 0-100mV into audible indication that is produced at instant when measured voltage exceeds reference voltage as set by decade switches of R7. Blind person can then read Braille markings at switch settings to get input voltage. Opamp B is connected as free-running MVBR that generates AF signal for earpiece. Use germanium transistors such as OC45 or OC71. Opamps are Motorola 1435.Use silicon diodes such as 1N914,BA100、or OA200 R7 can alternatively be wirewoundpot,-R.S. Maddevel.Meterfor Blind Students,Wireless World.Jan.1973.p36-37. (View)
View full Circuit Diagram | Comments | Reading(869)
RADIATION_MONITOR
Published:2009/7/3 1:36:00 Author:May
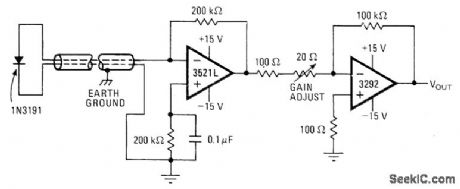
1N3191 commercial diode serves as sensor in high-accuracy dosagerate meter for gamma rays and high-energy Xrays used in radiotherapy. Diode is small enough for accurate mapping of radiation field.Output voltage varies linearly from 0.1 V to 10 V as dose rate increases from 10 to 1000 rads per minute. Low-drfft FET-input 3521L opamp amplifies detector current to usable level for 3292 chopper-stabilized opamp that provides additional gain while minimizing temperature errors.-P. Prazak and W. B. Scott, Radiation Monitor Has Linear Output, Electronics, March 20, 1975, p 117; reprinted in Circuits for Electronics Engineers, Electronics, 1977, p 106. (View)
View full Circuit Diagram | Comments | Reading(1595)
ADD_ON_FM_DETECTOR_
Published:2009/7/2 23:24:00 Author:May
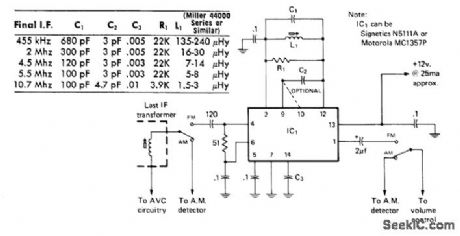
Suitable for any communication receiver. Other IF values can be handled by changing values of L and C. Connecting C2 to pin t0 instead of pin 9 may improve performance. Circuit is easy to construct and align; adjust slug-tuned coil for maximum recovered audio when receMng FM signal.-l. Math, Math's Notes, CQ, April 1975, p 37-38 and 62. (View)
View full Circuit Diagram | Comments | Reading(809)
PULSE_FREQUENCY_DETECTOR
Published:2009/7/2 23:20:00 Author:May
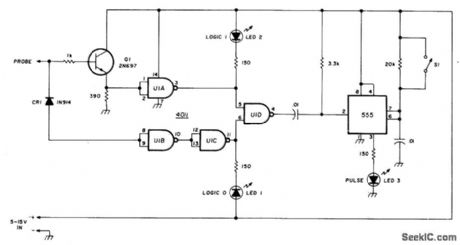
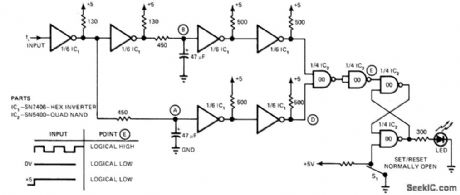
Can be usedas digital-logic probe or as frequency detectorfor test equipment,Requires only two ICs,SN7406 hex inverter and SN5400 quad NAND gate. Will respond to square-wave pulses with 50% duty cycles up to 3 MHz. When pulse appears at input, points A and B deteet logic high level and make point E go high so latch sets and tums on LED. Without an inputfrequency, A and B will be complementary and E、will go low,resetting latch and turning off LED.-V, Rende,Digital Frequency Detector Uses Only Two IC's,EON Magazine, April 20,1976,p114. (View)
View full Circuit Diagram | Comments | Reading(2347)
| Pages:62/101 At 206162636465666768697071727374757677787980Under 20 |
Circuit Categories
power supply circuit
Amplifier Circuit
Basic Circuit
LED and Light Circuit
Sensor Circuit
Signal Processing
Electrical Equipment Circuit
Control Circuit
Remote Control Circuit
A/D-D/A Converter Circuit
Audio Circuit
Measuring and Test Circuit
Communication Circuit
Computer-Related Circuit
555 Circuit
Automotive Circuit
Repairing Circuit