
Circuit Diagram
Index 808
28V_AT_1A
Published:2009/7/19 20:34:00 Author:Jessie
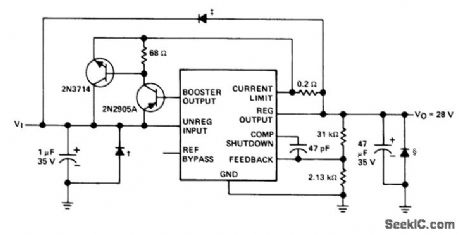
Circuit uses SN52105 or SN72305 regulator with three protective diodes. Feedback diode at top protects against shorted input and inductive loads on unregulated supply. Input diode protects against input voltage reversal. Output diode protects against output voltage reversal. Maximum input voltage is 50V.- The Linear and Interface Circuits Data Book for Design Engineers, Texas Instruments, Dallas, TX, 1973, p 5-9. (View)
View full Circuit Diagram | Comments | Reading(850)
ON_OFF_SWITCH
Published:2009/7/10 20:54:00 Author:May
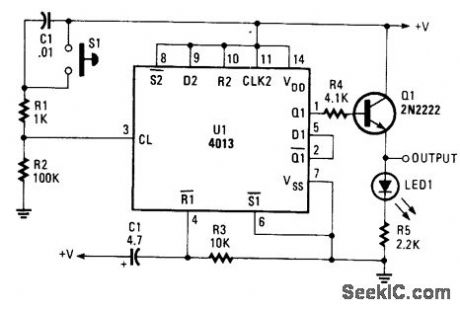
A CD 4013 dual-D flip-flop is used to drive an emitter-follower. This circuit can be used where a simple pushbutton on/off is desired. (View)
View full Circuit Diagram | Comments | Reading(7581)
Peak_to_peak_noise_measuring_circuit_for_frequencies_between_01_hertz_and_10_hertz
Published:2009/7/19 20:33:00 Author:Jessie
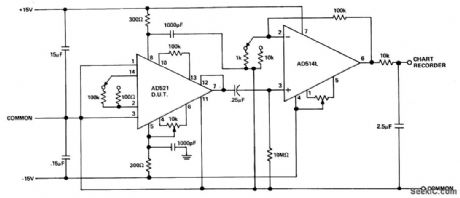
Peak-to-peak noise measuring circuit for frequencies between 0.1 hertz and 10 hertz. Typical measurements are made by reading the maximum peak-to-peak voltage noise of the device under test (DUT) for three periods for 10 seconds each (courtesy Analog Devices, Inc.). (View)
View full Circuit Diagram | Comments | Reading(1217)
Precision_analog_tachometer_using_an_MC14538B
Published:2009/7/19 20:32:00 Author:Jessie
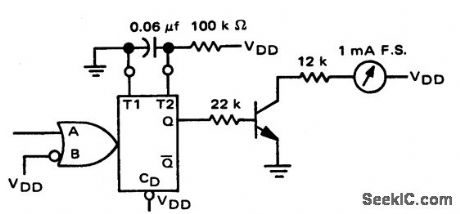
Precision analog tachometer using an MC14538B. The MC14538B operates as a monostable multivibrator with an output pulse of 6 ms. This pulse drives the transistor which in turn drives the meter. Full-scale calibration should be made at 167 hertz, which corresponds to 10,020 RPM (courtesy Motorola Semiconductor Products Inc.). (View)
View full Circuit Diagram | Comments | Reading(1309)
FULLY_LINEAR_DIODE_SENSOR_
Published:2009/7/10 20:53:00 Author:May
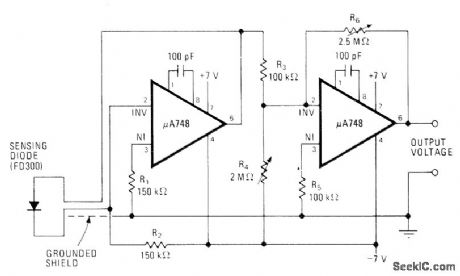
First opamp acts as constant-current source for temperature-sensing diode, making voltage drop across diode depend only on temperature. Second opamp offsets diode voltage to whatever temperature range is desired and provides gain that is adjustable with R6. R4, is used to set output at zero for selected temperature such as for 0℃. Circuit can then be adjusted to give 1 V at 50℃.-C. J. Koch, Diode or Transistor Makes Fully Linear Thermometer, Electronics, May 13, 1976, p 110-112. (View)
View full Circuit Diagram | Comments | Reading(1611)
PRF_GENERATOR
Published:2009/7/19 20:32:00 Author:Jessie

Blocking oscillator operates in range of 200 to 2,000 pps, as radar repetition-rate generator having frequency stability of about 5%.-NBS, Handbook Preferred Circuits Navy Aeronautical Electronic Equipment, Vol. 1 Electron Tube Circuits, 1963, p NS-2. (View)
View full Circuit Diagram | Comments | Reading(0)
±15_V_AND_5_V_CAR_BATTERY_SUPPLY
Published:2009/7/10 20:52:00 Author:May

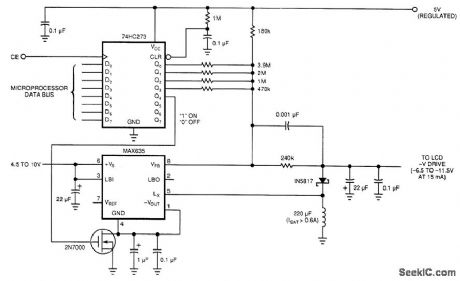
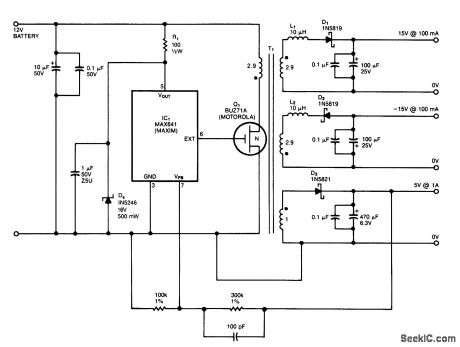
IC1is a switching regulator that generates a 45-kHz signal that drives the gate of MOSFET Q1.D1,D2, and D3 are Schottky diodes. The 5-V output is sensed as a reference; feedback to the chip turns offthe gate signal to Q1 if the voltage nses above 5 V.
T1 has Trifilar windings that assume about 2% regulation fr a 10-to 100-mA load change on the±15-V supplies, R1/D4 provide overvoltage protecti. T1 has a pnmary inductance ofabout 21 μH. Coreslze should allow 4-A peak currents. The turn ratios are 11 1/2 turns each for the 15-V supplies. 11 1/2 turns for the pnmary, and four turns for the 5-V secondary. The efficiency is about 75%. (View)
View full Circuit Diagram | Comments | Reading(1094)
SATELLITE_TV_AUDIO_SWITCHER
Published:2009/7/10 20:52:00 Author:May
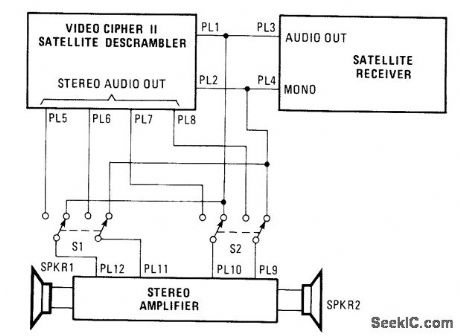
Some channels offer a separate audio mode (SAP) in a second language. It is usually transmitted on 6.8 MHz, which is the frequency used for unscrambled channels. The audio in the scrambled channels is transmitted along with the picture, so when the descrambler descrambles the signal, it also descrambles the audio in stereo. When the channel offers SAP, you'll find it on 6.8 MHz.The switches are a pair of DPDT switches that have the toggle handles tied together. In one position, you hear the audio in stereo and in the other position, you hear the SAP. Just turn down the volume level on the TV and you can connect it to a stereo amplifier and a pair of speakers. (View)
View full Circuit Diagram | Comments | Reading(770)
SOUND_LEVEL_METER_1
Published:2009/7/10 20:50:00 Author:May
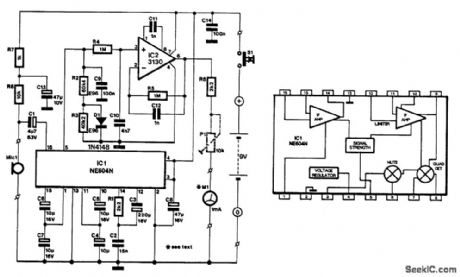
The NE604's signal-strength indicator section is used, based on an internal logarithmic converter.This enables a linear decibel scale so that the moving-coil meter (shown in the diagram) can be replaced by a digital instrument.
The signal source is assumed to be an electret microphone that converts ambient noise into an electri-cal signal. Because this type of microphone normally contains a buffer stage, R7, R8, and C13 have been included to provide the supply voltage for this stage.
The NE604 delivers an output current (at pin 5) of 0 to 50 μA, which causes a potential difference across R2+R3 of 0 to 5V. The input and output signal range is equivalent to a sound range of 70 dB. To compensate for the effects of temperature changes, the required resistance of 100 kΩ is formed by two resistors (R2 and R3) and a diode (D1).
Any ripple remaining on the output voltage is removed by R4/C9/C10 before the output is buffered by IC2. The indicating instrument, here a moving-coil meter, is connected to the output (pin 6) of IC2 via a series resistance, R6+P1. The preset is adjusted to give full-scale deflection (FSD) for an output voltage of 4V.
Calibrating the meter is a little tricky, unless you have access to an already calibrated instrument. Oth-erwise, if you know the efficiency of your loudspeaker, that is, how many decibels for 1W at 1m, you can use that as reference. The scale of the meter can then be marked with the (approximate) value. In any case, the meter deflection must at all times be seen as an indication, not as an absolute value: it was not thought to be worthwhile to add a filter to the circuit to enable absolute measurements to be made.
(View)
View full Circuit Diagram | Comments | Reading(2331)
DIODE_RF_SWITCH
Published:2009/7/10 20:47:00 Author:May
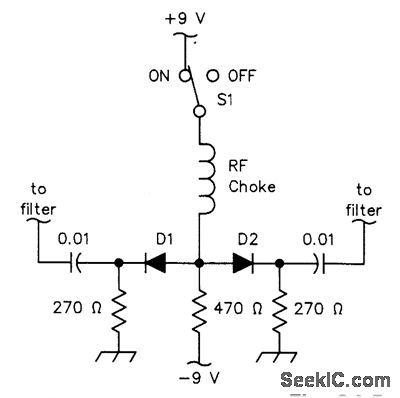
D1 and D2 can be IN914B- or HP2800-senesdiodes(for UHF).The loss is over 60 dB h the OFF state,and less than 3 dB at 3.5 to 30 MHz(using common IN914B diodes). (View)
View full Circuit Diagram | Comments | Reading(865)
High_precision_tachometer
Published:2009/7/19 20:32:00 Author:Jessie
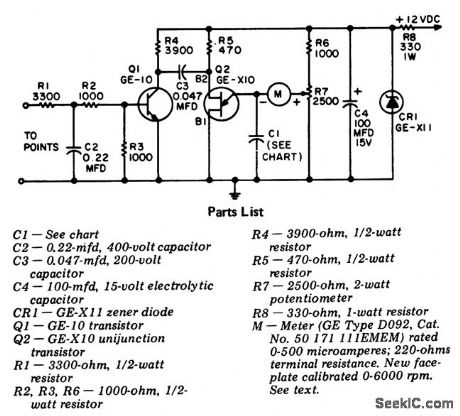
High-precision tachometer. Capacitor C1 is rated at 200 volts. The meter shown is a standard panel meter with a 0 to 500 μA range. It is available from GE with a modified faceplate. For information about the modified meter write to General Electric Company, Tube Dept., Attention R.G. Kempton, 316 East Ninth St., Owenboro, KY 42301. R7 is used to calibrate the tachometer before it is installed. Feed a 60-hertz signal to the input (to point). On four stroke engines with four cylinders adjust for 1800 RPM, with six cylinders adjust for 1200 RPM and with eight cylinders adjust for 900 RPM. On two stroke engines with three cylinders adjust for 1200 RPM and with four cylinders adjust for 900 RPM. The 60-hertz signal should be no greater than 9 volts AC (courtesy General Electric Company). (View)
View full Circuit Diagram | Comments | Reading(951)
PRECISION_NARROW_BAND_TONE_SWITCH
Published:2009/7/10 20:43:00 Author:May
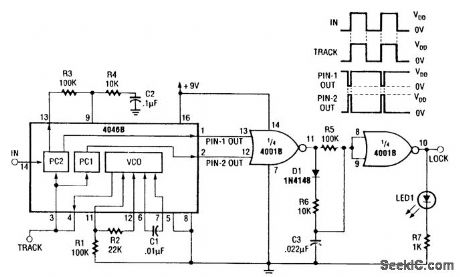
This signal tracker and lock detector combine to make a precision tone switch. Filter R3/R4/C2 determines signal capture and tracking range, as well as settling time.. Max. VCO frequency: R1C1. Min. VCO frequency: (R1+R2)C2Pin 9 voltage affects both. The minimum at pin 9 is 0 V and the maximum at pin 9 is VDD. In the lock detector, the PC (phase comparator) outputs are pulses whose width is proportional to the phase difference between the two PC inputs. At lock up, the two PC outputs are almost mirror images. The output of IC1A remains low and IC1B is high. This lights LED1. If the loop is unlocked, the LED will not light. (View)
View full Circuit Diagram | Comments | Reading(753)
Ratiometric_measurement_circuit_using_an_ADC171_dual_slope_integrating_
Published:2009/7/19 20:30:00 Author:Jessie
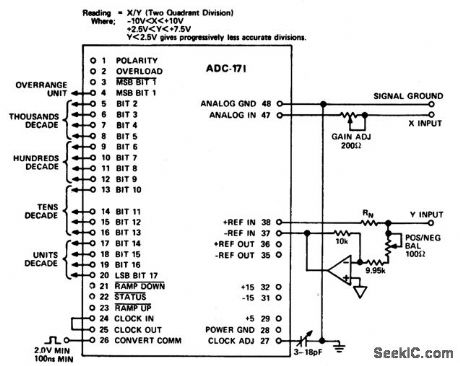
Ratiometric measurement circuit using an ADC171 dual-slope integrating A/D converter (courtesy Analog Devices, Inc.). (View)
View full Circuit Diagram | Comments | Reading(696)
Decibel_measurement_circuit_using_an_AD536_true_RMS_to_DC_converter_chip
Published:2009/7/19 20:29:00 Author:Jessie
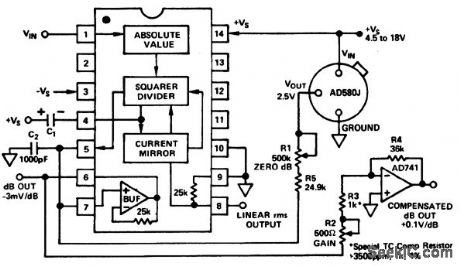
Decibel measurement circuit using an AD536 true RMS-to DC converter chip (courtesy Analog Devices, Inc.). (View)
View full Circuit Diagram | Comments | Reading(1726)
STEREO_AUDIO_POWER_METER
Published:2009/7/10 20:43:00 Author:May
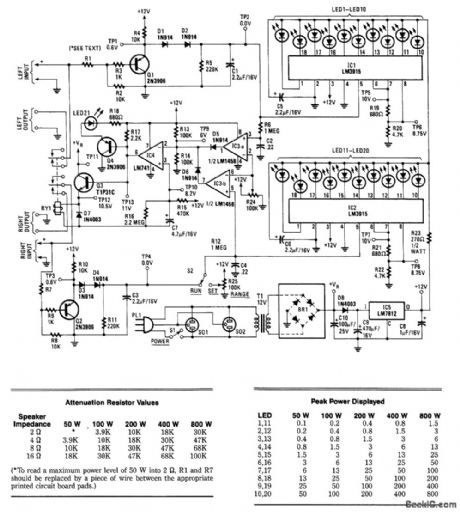
This circuit is used to meter the audio power output of an amplifier feeding a speaker. RY1 is actuated if excess power is fed to the speaker. Two channels are included for stereo applications. R1 and R2 and R3 form an attenuator. When a signal level is reached that produces a voltage across C1, comparator IC3A goes high, and IC4 and Q4produce enough drive to Q3 to trip relay 1, which cuts off the speakers. LED21 will light as well. In addition, IC1 reads the voltage across C1. IC1 is a bar-graph driver, which lights bar-graph display LED1 through LED10. (View)
View full Circuit Diagram | Comments | Reading(1125)
Decibel_measurement_circuit_using_an_AD536_true_RMS_to_DC_convener_chip_with_power_output_to_a_linear_meter_display
Published:2009/7/19 20:28:00 Author:Jessie
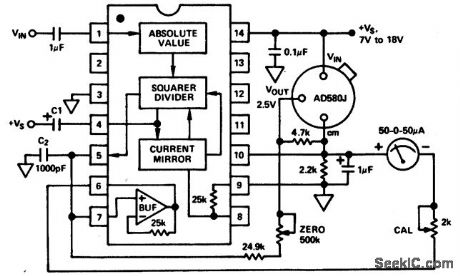
Decibel measurement circuit using an AD536 true RMS-to-DC convener chip with power output to a linear meter display (courtesy Analog Devices, Inc.). (View)
View full Circuit Diagram | Comments | Reading(2358)
SCR_OVERVOLTAGE_PROTECTOR
Published:2009/7/10 20:37:00 Author:May
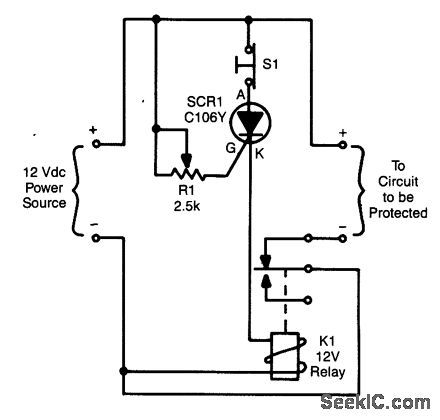
Depending on the setting of R1, when the voltage exceeds a certain amount, SCR1 triggers, which activates K1 and opens the circuit. S1 resets the SCR. (View)
View full Circuit Diagram | Comments | Reading(1010)
Wattmeter_for_an_audio_amplifier_to_100_watts
Published:2009/7/19 20:27:00 Author:Jessie
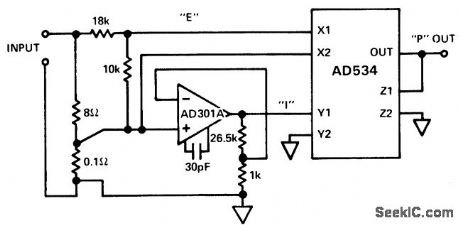
Wattmeter for an audio amplifier to 100 watts. To use the circuit connect a nonreactive 8-ohm 10-watt load to the speaker terminals with the 0.1-ohm shunt in series with it, The output of the amplifier should be connected to the circuit with AWG #16 wire (courtesy Analog Devices, Inc.). (View)
View full Circuit Diagram | Comments | Reading(1505)
CONSTANT_Q_FROM_1_CPS_TO_10_KC
Published:2009/7/17 9:47:00 Author:Jessie
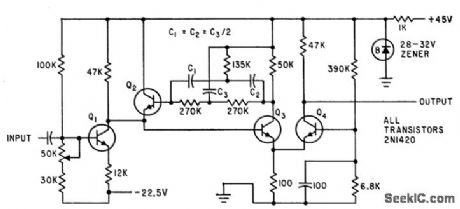
Symmetrical parallel-T R-C rejection filter in negative feedback loop of amplifier gives Q of 28 over frequency range, for frequency dependent noise measurements. Gain is about 5, and maximum output is about 5 V rms. –R. E. Hobson and L. Colcagno, Narrow Pass-Band Amplifier with Parallel-T Network, Electronics, 34:33, p 68. (View)
View full Circuit Diagram | Comments | Reading(673)
SOUND_LEVEL_METER
Published:2009/7/10 20:35:00 Author:May
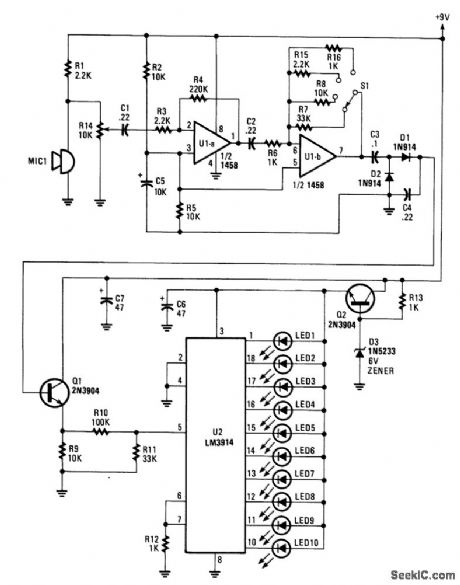
An electret microphone feeds an audio amplifier/rectifter combination. The amplifier has switchable gain. The rectifier output drives an LM3914 bar-graph generator. R14 provides fine gain control. (View)
View full Circuit Diagram | Comments | Reading(0)
| Pages:808/2234 At 20801802803804805806807808809810811812813814815816817818819820Under 20 |
Circuit Categories
power supply circuit
Amplifier Circuit
Basic Circuit
LED and Light Circuit
Sensor Circuit
Signal Processing
Electrical Equipment Circuit
Control Circuit
Remote Control Circuit
A/D-D/A Converter Circuit
Audio Circuit
Measuring and Test Circuit
Communication Circuit
Computer-Related Circuit
555 Circuit
Automotive Circuit
Repairing Circuit