
Measuring and Test Circuit
Index 98
The temperature indicator circuit diagram composed of MAX139
Published:2011/5/9 21:35:00 Author:Ecco | Keyword: temperature indicator
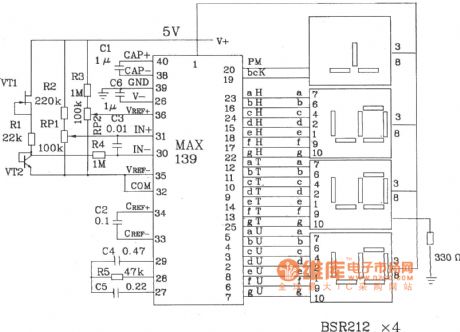
The temperature indicator circuit diagram composed of MAX139 is shown as the chart.
(View)
View full Circuit Diagram | Comments | Reading(2185)
Temperature measuring circuit diagram composed of AD7714 and thermocouple
Published:2011/5/6 4:15:00 Author:Ecco | Keyword: Temperature measurement circuit , thermocouple
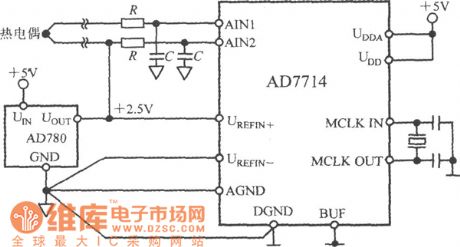
Temperature measuring circuit diagram composed of AD7714 5-channel low-power programmable sensor signal processor and thermocouple
Temperature measuring circuit diagram composed of AD7714 and thermocouple is shown as the chart. In this application, AD7714 operates in buffered mode, which allows the former termination connecting decoupling capacitors to filter out the noise on the thermocouple leads. In buffered mode, AD7714 common-mode is narrow, the differential thermocouple voltage is in the appropriate range of the common-mode voltage, AD7714's AIN2 input should be biased to +2.5 V reference voltage. (View)
View full Circuit Diagram | Comments | Reading(1012)
Pressure measuring system circuit diagram composed of AD7714
Published:2011/5/6 4:10:00 Author:Ecco | Keyword: Pressure measuring system
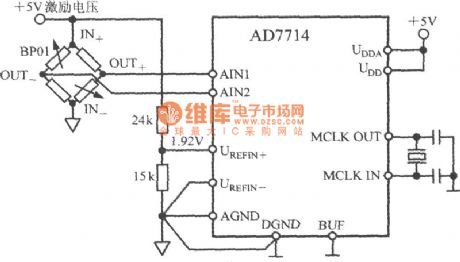
Pressure measuring system circuit diagram composed of AD7714 5-channel low-power programmable sensor signal processor
Pressure measuring system circuit diagram composed of AD7714 is shown as the chart. BP01 is pressure sensor produced by Sensym. The BP01 is connected into a bridge circuit, the OUT +, OUT- ends output differential voltage. When pressure sensor is set the full scale rated pressure (in this case it is 40kPa), its differential output voltage sensitivity is 3mV / V. If it uses +5 V excitation voltage, the sensor full-scale output range is ± 15mV. The excitation voltage has been divided by 24kΩ and 15kΩ resistor to provide 1.92V reference voltage for AD7714, the excitation voltage fluctuations do not cause the measurement error to system. (View)
View full Circuit Diagram | Comments | Reading(935)
AC measuring circuit diagram
Published:2011/5/8 21:50:00 Author:Nicole | Keyword: AC measuring
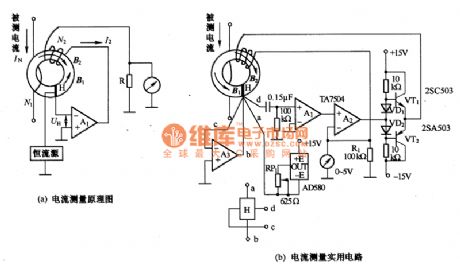
The figures(a), (b) are as shown, they are AC measuring circuits. The 21(a) is a current measuring schematic diagram of magnetic balanced mode Hall device. If the magnetic field produced by the measured current IN is B1, then B1 will produce Hall voltage. If this voltage passes though A1, the produced current I2 is fed to feedback coil N2. When the Hall voltage UH=O, I2 reaches balance. Thus, INN1=fzN2, that is I2=(N1/N2)IN. If using resistance R to measure I2, then it can obtain a measured value which is in proportion to IN.
The figure21(b) is as shown, it is a current measurement practical circuit. Hall device adopts KH-400 of lnSb material. The constant current source circuit is composed of AD580, it provides H with 5mA control current. A1 is amplifier, A1's amplified voltage is changed to current by A2, it is lower than A2 output current, it is below 20mA, it is very tiny, so it should connect a current buffer amplifier which is composed of VT1 and VT2 to A2 output terminal. R1's voltage drop is shown on the meter, the shown value is the measured value. (View)
View full Circuit Diagram | Comments | Reading(4375)
Relative humidity measuring instrument circuit diagram
Published:2011/5/6 1:41:00 Author:Ecco | Keyword: Relative humidity, measuring instrument
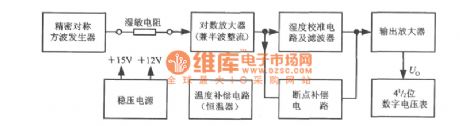
Relative humidity measuring instrumentblock diagram
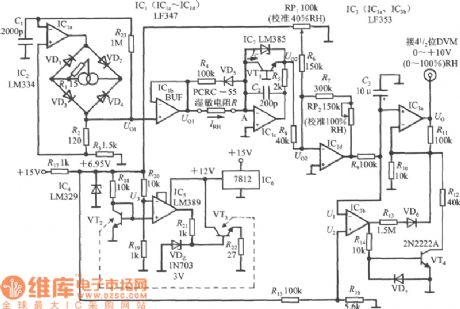
Relative humidity measuring instrument circuit
(View)
View full Circuit Diagram | Comments | Reading(1256)
Particle detector circuit
Published:2011/5/8 21:54:00 Author:Christina | Keyword: Particle, detector
View full Circuit Diagram | Comments | Reading(799)
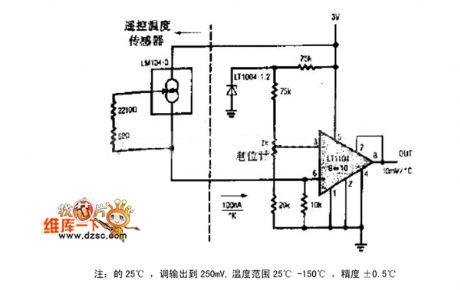
Digital remote thermometer(FDD5/JDD5) circuit diagram
Published:2011/4/8 3:02:00 Author:Rebekka | Keyword: Digital remote thermometer
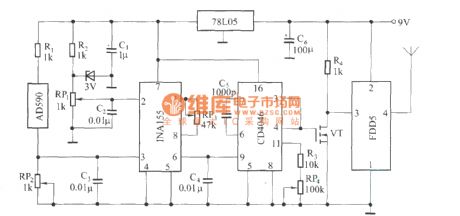
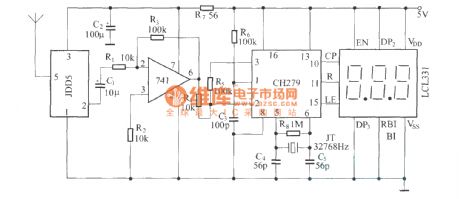
Transmitter circuit:
Temperature detection circuit is composed of integrated temperature sensor AD590. It can convert temperature changes into output current changes. The output current of AD590 should be proportional to measured temperature. As the temperature increases, the output current 1μA / K a constant rate should increase. When the output current pass RP2, it will form into voltage drop on its upper. After being amplified by the voltage amplifier, the voltage will be the voltage of frequency converter.
(View)
View full Circuit Diagram | Comments | Reading(2383)
Schematic of The Encoded Three-Channel Transmitter and Receiver Composed Of KIA733P and KIA7657P
Published:2011/4/26 9:06:00 Author:TaoXi | Keyword: Encoded, Three-Channel, Transmitter and Receiver
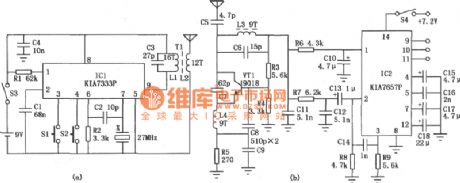

By encoding the transmitter circuit, the 3 channels of the receiving circuit can be used in different applications, remote control three kinds of circuits. The coded transmission circuit is shown in Figure (a).
The receiving circuit is shown in Figure (b). IC2 is the receiver decoder IC (KIA7657P) which includes two-stage amplifier, automatic adjustment circuit, decoder and three pairs of compound (darlington) driver tube, additionally, it has a 5V power supplier to supply power to the whole circuit. The C14、R8、R9 between 2 pin and 3 pin are amplification gain and automatically adjustment components, Cl5~Cl8 are the amplifier capacitor decoder and filter capacitor decoder. The 9~11 pins of the IC2 export the decoding signal, available in low level, and the sink current can be up to 100mA. This circuit issuitable to control the toy, electric curtain, automatic door, crane and construction crane.
Figure 1. Schematic of The Encoded Three-Channel Transmitter and Receiver Composed Of KIA733P and KIA7657P
Shown in Table 1. (View)
View full Circuit Diagram | Comments | Reading(837)
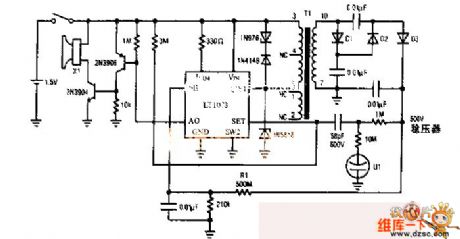
Measureing And Test Circuit about High Voltage Capacitor
Published:2011/5/5 9:54:00 Author:Felicity | Keyword: Measureing And Test Circuit, High Voltage Capacitor,
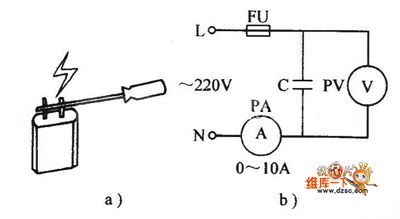
The picture above shows the Measuring And Test Circuit about High Voltage Capacitor. (View)
View full Circuit Diagram | Comments | Reading(672)
XTR106 Thermocouple Measuring Loop Circuit
Published:2011/5/3 6:48:00 Author:Robert | Keyword: Thermocouple, Measuring Loop
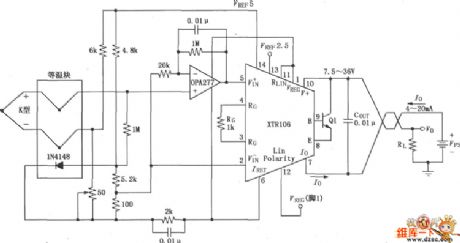
The circuit shown below is athermocouple measuring loop circuit which hasdiode cold-junction compensation with features of low offset, low drift. The noninverting amplifier is constituted by the OPA277, and use the noninverting amplifier's high input impedance to reduce thermocouple offset and loop drift. The 50Ω potentiometer is used for calibration, and the user can use itto adjust the noninverting input offset of the amplifier to change the K type thermocouple's output currentin the range of4mA to 20mAinits corresponding working temperature range.
(View)
View full Circuit Diagram | Comments | Reading(1396)
Battery Driving Temperature Sensor Circuit
Published:2011/5/3 5:02:00 Author:Felicity | Keyword: Battery Driving Temperature Sensor Circuit,
The picture above shows the battery temperature sensor circuit. (View)
View full Circuit Diagram | Comments | Reading(885)
Measuring and Test Circuit of UBES/Uth/Ids
Published:2011/5/3 8:14:00 Author:Felicity | Keyword: Measuring and Test Circuit of UBES/Uth/Ids ,
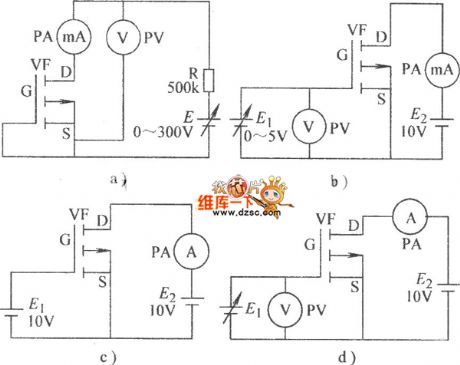
The picture above shows the measuring and test circuit of UBES/Uth/Ids. (View)
View full Circuit Diagram | Comments | Reading(648)
Level test circuit diagram composed of 4011 CMOS NAND gate connected as an inverter
Published:2011/5/3 4:21:00 Author:Ecco | Keyword: level test , CMOS , NAND gate, inverter
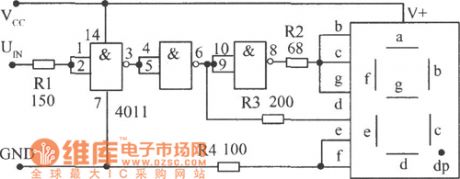
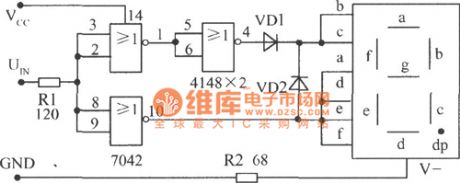
The level test circuit diagram composed of 4011 CMOS NAND gate connected as an inverter is shown as the chart. In this circuit, it can use NOT gate to instead of 4011. High level shows H, low level displays L. Since R2 ~ R4 has played the role of limiting current, the digital tube and its anode is connected directly with the positive power supply Vcc. The high, low level illuminated strokes e, f are connected to ground by R4, it may reduce the driving current.
(View)
View full Circuit Diagram | Comments | Reading(1236)
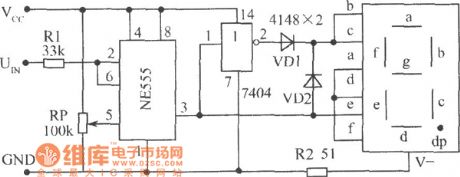
The level test circuit diagram composed of NE555 single time base circuit
Published:2011/5/3 4:07:00 Author:Ecco | Keyword: level test , single , time base circuit
View full Circuit Diagram | Comments | Reading(736)
The level test circuit diagram
Published:2011/5/3 3:57:00 Author:Ecco | Keyword: level , test
TTL NOR gate is connected as inverter, and it is equipped with common cathode LED,the high level shows q, low level displays 0. The circuit is shown in Fig.
(View)
View full Circuit Diagram | Comments | Reading(729)
Hypoxia monitoring circuit diagram
Published:2011/5/3 1:24:00 Author:Nicole | Keyword: hypoxia, monitoring
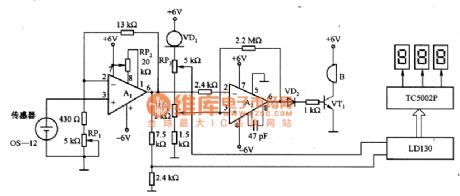
The figure 1 is a hypoxia monitoring circuit. Its sensor adopts battery oxygen sensor OS-12. In the oxygen concentration range of 0%~100%, OS-12 has characteristic of linear output, if the sensor output is connected to A/D converter, then it can accurately display the monitored oxygen concentration as digital form. Hypoxia monitoring circuit uses 3 LED nixietubes to display the monitored oxygen concentration, when the oxygen concentration is less than 18%, buzzer B will send out hypoxia warning singal.
A1 is DC amplifier, it can amplify the sensor output about 20 times, the amplified singal is added to LD130, 3 LED nixietubes are drived by decoding driver TC5002P, the oxygen concentration will be dispalyed as digital form. VD1 is constant current diode, it provides LDl30 with 2V voltage reference. It also provides A2 comparator circuit in-phase input terminal with voltage reference. To adjust RP4 to make the oxygen concentration is less than 18%, then A2 outputs high level, VT1 turns on, B sends out alarm.
(View)
View full Circuit Diagram | Comments | Reading(2531)
Logic level test circuit diagram
Published:2011/5/3 0:49:00 Author:Ecco | Keyword: logic level, test
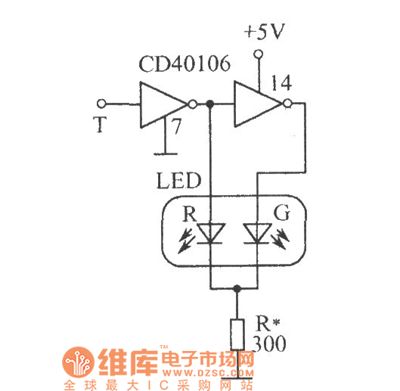
Logic level test circuit is shown as the chart. CD40106 is six inverter with a Schmitt trigger, T is the probe, when the T contacting point is 0 , after driven by inverting, LED-R emits red light, LED-G is off; when the detection point is 1 , LED-R reverse bias is off, but after being twice reversed, LED-G emits green light; when the T detects CP pulse, the two tube is lit alternately. As the clock pulse frequency is higher, while it is higher than 24Hz, the two tubes seem like being lit simultaneously because of the visual pictures effect of eyes, rather than flash alternately, the light is orange.
(View)
View full Circuit Diagram | Comments | Reading(1097)
Short circuit tester circuit diagram
Published:2011/4/29 3:57:00 Author:Ecco | Keyword: Short circuit , tester
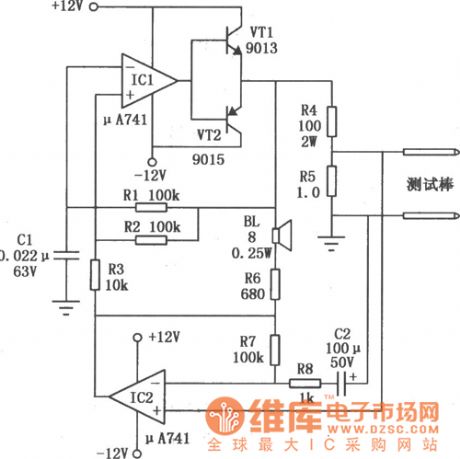
Short circuit tester circuit is shown as the chart, it can easily detect the short circuit after component soldering on cable or printed circuit board. When the testing stick closes to the short circuit point, the pitch will increase with it.
(View)
View full Circuit Diagram | Comments | Reading(2302)
Pressure measurement circuit diagram composed of OP27
Published:2011/4/29 2:24:00 Author:Nicole | Keyword: Pressure measurement
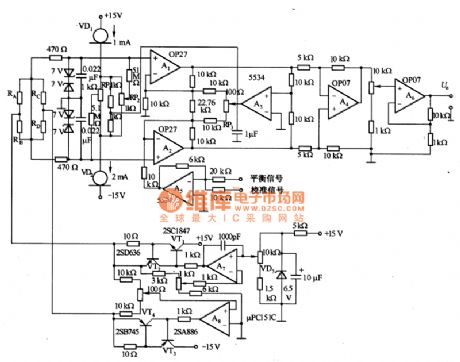
The figure 1 is a pressure measurement circuit which is composed of OP27. In the circuit, the instrumentation amplifier is composed of A1、A2、A4, the amplitude limiter circuit is composed of input partial four 7V regulator tubes. PR1 and PR2 is used to adjust the input bias current of A1, A2 to 200nA. In order to improve the common-mode rejection ratio, it should be connected to circuit, RP3 is used to adjust the common-mode rejection ratio. VT1-VT4 and A7, A8 provide pressure sensor with work power supply.
(View)
View full Circuit Diagram | Comments | Reading(1760)
Pressure measurement circuit diagram composed of OPO7
Published:2011/4/29 2:36:00 Author:Nicole | Keyword: Pressure measurement
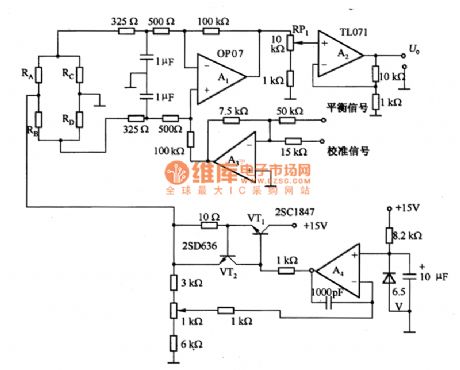
The figure 1 is a pressure measurement circuit which is composed of OPO7. In the circuit, A2 uses Bi-FET input operational amplifier, when adjust potentiometer RP1, it can avoid the zero drift which is caused by bias current. A3 is initial balanced circuit and singal calibration circuit. The precision of amplifier is 0.5%, but the allowable bridge resistance precision is ±10%. In reality, it can be improved if take measures. The common-mode rejection ratio is about 90dB, 1kHz band noise is about 1~2μV(peak-peak value). It provides pressure sensor with constant current.
(View)
View full Circuit Diagram | Comments | Reading(1942)
| Pages:98/101 At 2081828384858687888990919293949596979899100Under 20 |
Circuit Categories
power supply circuit
Amplifier Circuit
Basic Circuit
LED and Light Circuit
Sensor Circuit
Signal Processing
Electrical Equipment Circuit
Control Circuit
Remote Control Circuit
A/D-D/A Converter Circuit
Audio Circuit
Measuring and Test Circuit
Communication Circuit
Computer-Related Circuit
555 Circuit
Automotive Circuit
Repairing Circuit