
Measuring and Test Circuit
Index 84
TRANSISTOR_CHECKER
Published:2009/6/17 22:01:00 Author:May
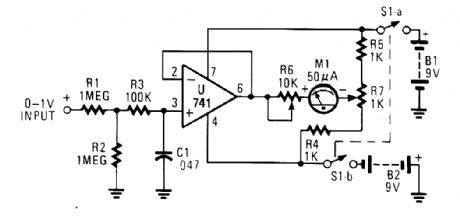


The circuit is built around a 741 general-purpose op amp that is configured as a voltage follower; with the components shown, the op amp has a voltage gain of one. The output of the 741 is used to drive a 50-pA meter rnovement. Potentiometer R7 is used to zero the meter and R6 sets the meter's full-scale reading.
Calibrating the meter is a snap. With no input applied to the circuit, set R6 to mid-position and adjust R7 to zero the meter. Once that is done, apply a positive 1-Vdc voltage to the input and adjust R6 for a full-scale reading. The voltmeter can be adjusted to read both positive and negative voltages by adjusting R7 for a center scale reading at the meter's zero position and a positive 1-V reading at the meter's full-scale position. (View)
View full Circuit Diagram | Comments | Reading(1338)
ONE_IC_CAPACITANCE_TESTER
Published:2009/6/17 22:01:00 Author:May
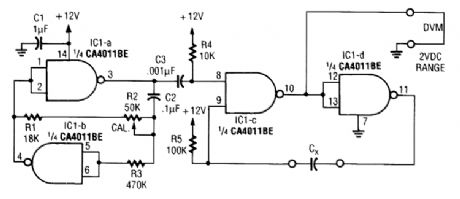
This circuit can be used to match capacitors, etc. The dc output voltage is related to the capacitance values of Cx The circuit values shown are for capacitors in the 0.01-μF order of magnitude, but they can be changed for lower or higher values. (View)
View full Circuit Diagram | Comments | Reading(833)
AUDIO_FREQUENCY_METER
Published:2009/6/17 21:59:00 Author:May
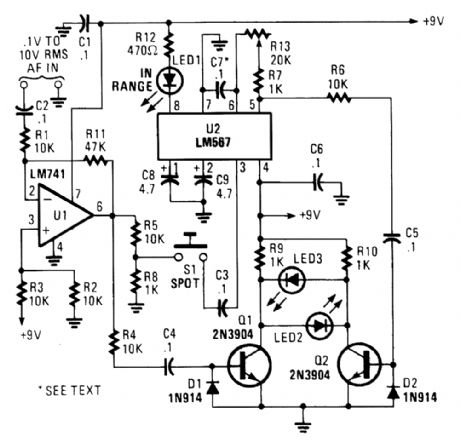
This meter differs from the norm in that it does not use a D'Arsonval movement or digital display to give a reading of the input frequency. Instead, the measured frequency is read from a hand-cali-brated dial.
Any audio signal applied to the circuit is amplified by UI and the resulting output is divided along two paths. In one path, the output signal is applied to the miter; in the other path, the signal is ap-plied to the input of U2 through S1 (a normally open pushbutton switch).
The portion of the amplifier signal that is fed to the mixer is applied to the base of Q1, causing it to toggle on and off at the signal frequency. In the other path, when S1 is pressed, a portion of the op amp's output is applied to U2. If the signal is within the range of U2's internal oscillator's operating frequency, LED1 lights, and a signal is fed to the base of Q2. If the two signals arriving at the mixer do not match exactly, LED2 and LED3 light. That means that the circuit must be fine tuned, which is accomplished by releasing S1 and fine tuning RIB until LED2 and LED3 go out. The dial setting at that point gives the frequency of the input signal to within 1 Hz (or as close as the calibrated dial will allow). (View)
View full Circuit Diagram | Comments | Reading(1552)
ac_WATTS_CALCULATOR
Published:2009/6/17 21:55:00 Author:May
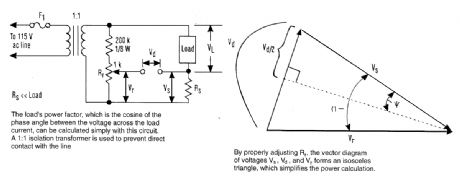
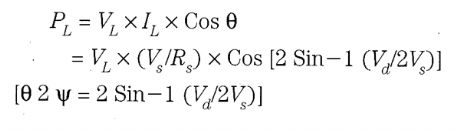
The method basically consists of determining the power factor of the load-the cosine of the phase angle between the voltage across the load and the load circuit. Using a simple circuit, that an-gle can be calculated quite simply.This circuit uses a 1:1 isolation transformer to prevent direct contact with the line. It is wise to proceed with caution whenever voltages of this magnitude are utilized in a test setup, even though the voltages that will be measured are usually below 1 V.RS is a circuit-sense resistor and Rr is a multi-turn potentiometer. The voltage across Rr is ap-proximately 0.5% of the line voltage, which should be sufficient for most applications.Rr is adjusted so that |Vr|=|Vs|; then Vd is measured. In the vector diagram according to Kirchhoff's voltage law, Vs,Vd, and Vr form a triangle, which becomes isosceles by adjusting Rr. Vs is in phase with the load current and Vr is essentially in phase with the load voltage.The power delivered to the load can be calculated as follows: (View)
View full Circuit Diagram | Comments | Reading(810)
50_MHz_RF_BRIDGE
Published:2009/6/17 21:51:00 Author:May
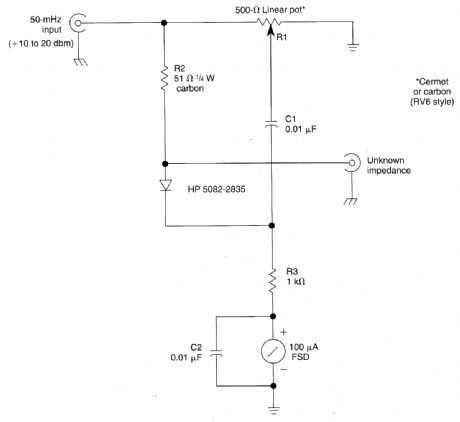
The bridge shown was used for rtteasurements on 50-MHz amateur radio antennas. R1 is a miniature 500Ω linear potentiometer. The unknown impedance is compared to R2, a 51-Ω resistor. An external signal source is required. (View)
View full Circuit Diagram | Comments | Reading(692)
MERCURY_SWITCH_TILT_DETECTOR
Published:2009/6/17 21:50:00 Author:May
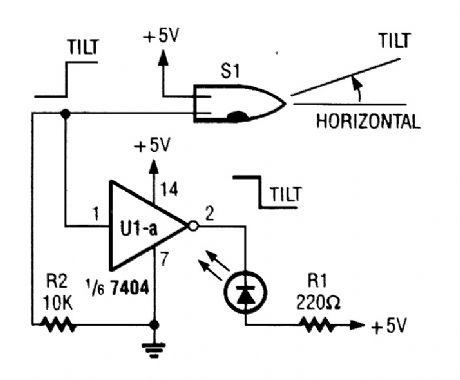
If the mercury bulb in this circuit is tipped,U1-a will light LED1 by going low, indicating a“tilted”condition. (View)
View full Circuit Diagram | Comments | Reading(902)
LIGHT_METER
Published:2009/6/17 21:49:00 Author:May
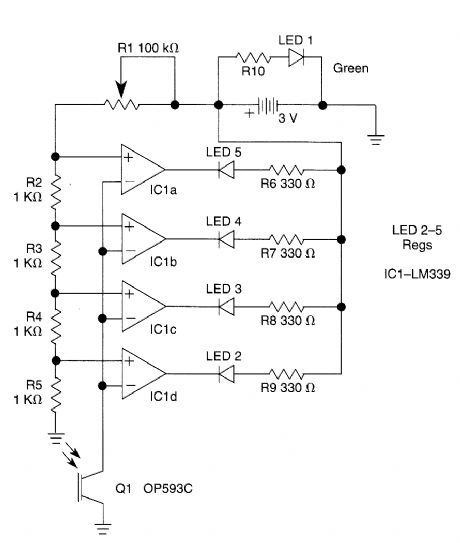
The outputs from the comparators will swing, in sequence, from high to low as the input voltage rises above the reference voltage applied to each comparator. The output LEDs will then switch on in sequence as the voltage rises.The inverting inputs of the comparators are connected in common to the collector of photo-transistor Q1. When Q1 is illuminated, its collec-tor-emitter junction conducts, thereby placing all the inverting inputs within a few millivolts of ground. For most settings of RI, each of the four reference voltages exceeds the value. Therefore, when Q1 is illuminated, the output from each comparator is high and its respective indicator LED is off. (View)
View full Circuit Diagram | Comments | Reading(1073)
LOW_DRIFT_dc_VOLTMETER
Published:2009/6/17 21:47:00 Author:May
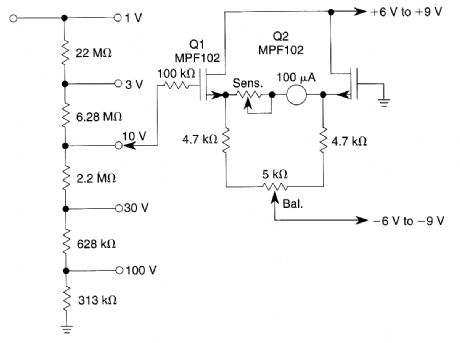
This voltrneter uses a pair of JFETs in a balanced-bridge source-follower amplifier circuit. Q1 and Q2 should be matched within 10% for IDSS This minimizes meter drift and maintains bridge balance over temperature.
(View)
View full Circuit Diagram | Comments | Reading(807)
COMBUSTIBLE_GAS_DETECTOR
Published:2009/6/17 4:15:00 Author:May
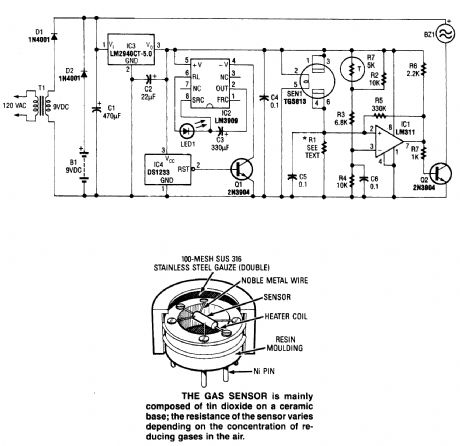
The circuit shown is useful for the detection of dangerous levels of combustible fumes or gases. It uses a comparator circuit to trigger an alarm buzzer. The sensor's resistant element is connected in series with resistor R1 to form a voltage-divider circuit; R1 is specifically matched to each gas sensor by the manufacturer. (View)
View full Circuit Diagram | Comments | Reading(3040)
SIMPLE_CURVE_TRACER
Published:2009/6/17 4:10:00 Author:May
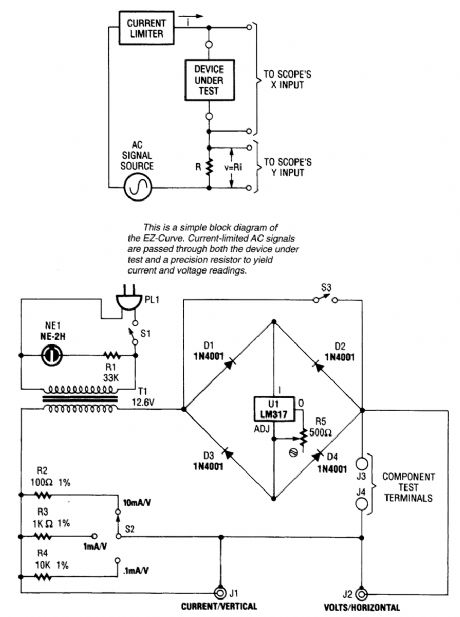
Useful for checking diodes, transistors, triacs, SCRs, resistors, and LEDs, this curve tracer should prove useful in the experimenter's lab. It displays the volt-ampere characteristic of a two-ter-minal device on an oscilloscope. (View)
View full Circuit Diagram | Comments | Reading(2665)
CABLE_TESTER
Published:2009/6/17 4:09:00 Author:May
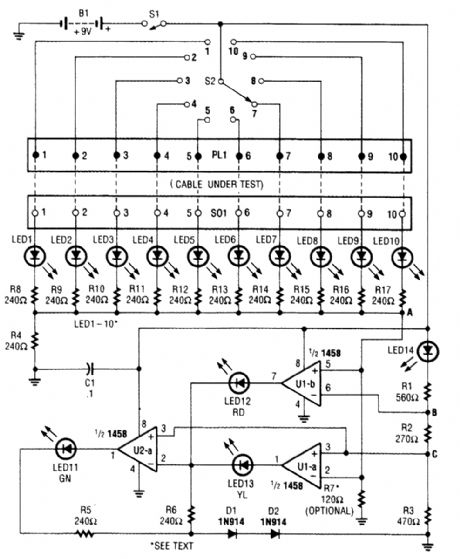
At the heart of the cable tester are two op amps, which are used as a window comparator to indicate a short- or open-circuit condition. A third op-amp comparator is used to indicate a good circuit (i.e., neither open nor shorted). Colored LEDs are used to show the condition of individual conductors within the cable under test; a red one to indicate a short between conductors, a yellow one to identify an open conductor, and a green one to signify that the conductor is okay. Individual LEDs of a bar-graph display are used to show which conductor in the cable is being tested. (View)
View full Circuit Diagram | Comments | Reading(3974)
RADAR_CALIBRATOR
Published:2009/6/17 4:07:00 Author:May
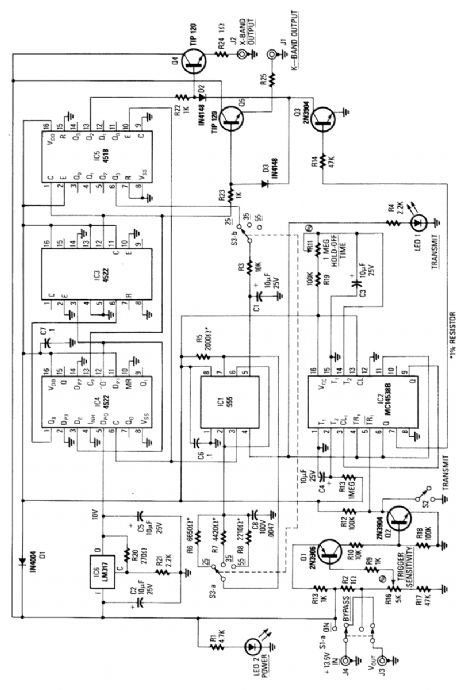
This circuit is basically a system that generates a pulsed modulation signal for a Gunn diode microwave oscillator. Several speed settings are preset (S3 a and b). A 555 timer is used with a frequency divider chain to produce Doppler shift equivalents of 25, 35, and 55 mph, for both X- and D-band radars. (View)
View full Circuit Diagram | Comments | Reading(1676)
DIGITAL_ALTIMETER
Published:2009/6/17 4:03:00 Author:May

A pressure sensor (IC4) is used with a dc amplifier to convert the bridge output (IC4) to a sin-gle-ended voltage. ICld provides a reference voltage for setting barometric pressure. IC3 is an A/D converter manufactured by Intersil. This drives an LCD module. Calibration reads out in fact. A vac-uum pump and a water-based manometer can be used for sensor calibration. (View)
View full Circuit Diagram | Comments | Reading(2243)
EXPLOSIVE_GAS_DETECTOR
Published:2009/6/17 4:00:00 Author:May
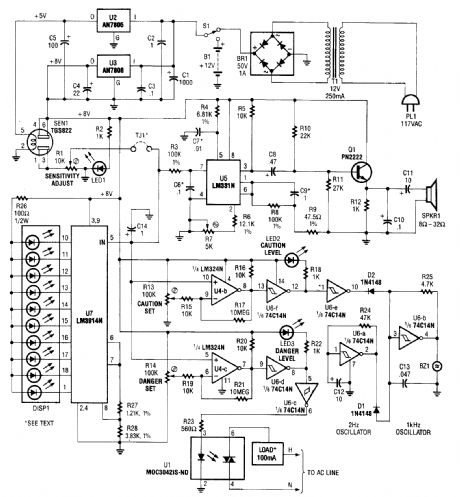
A gas sensor (TGS823 from Allegro Electronics, Cornwall Bridge, CT 06754) conducts in the presence of explosive gases. U5 is a voltage-to-frequency converter that produces a frequency proportional to the sensor conductance. The output frequency ranges from 100 Hz in clean air to 8 kHz in a contaminated atmosphere. The dc voltage from the sensor also drives bar graph LED U7 and comparators U4-b and U4-c to sense present caution and danger levels. U1 drives an ac load up to 100 mA (relay, indicator, alarm, etc.). (View)
View full Circuit Diagram | Comments | Reading(1988)
VISUAL_CONTINUITY_TESTER
Published:2009/6/17 3:58:00 Author:May
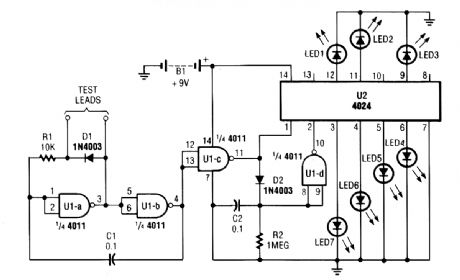
By judging the rate at which a particular LED flashes, you'll be able to estimate the resistance.The circuit consists of two IC's (1 4011 CMOS quad 2-input NAND gate, UI; and a 4024 binary counter, U2), seven LEDs, and a handful of additional components. All of the gates in UI are wired as inverters.Two of the inverters (U1-a and UI-b) comprise an astable-multivibrator (free-running oscillator) circuit, whose operating frequency depends on the amount of resistance detected between the test probes. Feedback from the output of the oscillator (at pin 4 of U1-b) back to the input of the circuit (at U1-a, pins 1 and 2) is provided via C1. Resistor, RI, along with the unknown resistance between the test probes, completes the RC timing circuit. The frequency of the oscillator decreases as the re-sistance between the test probes increases.The output ofthe oscillator is fed to pin 12 and 13 of UI-c, the output of which then divides along two paths. In the first path, UI-c's output is applied to the clock input of U2 (a 4024 binary counter) at pin 1; in the other path, the signal is fed through D2 and across capacitor C2, causing it to begin charging. The charge on C2 is applied to UI-d at pins 8 and 9. The output of that inverter (UI-d) is fed to the reset terminal (pin 2) of U2. If there is continuity or a measurable resistance between the test probes, U2's reset terminal is pulled low, triggering the counter and allowing it to process the in-put pulses (count).The rate of the count is proportional to the resistance between the test probes. If the resistance between the test probes is low, the counter advances slowly. The counter provides a 7-bit binary out-put that is wired to seven LEDs.When the test probes are placed across a short circuit, LED7 flashes. If the tester is placed across a resistance of, for example, 2 MO, LED1 will flash. In either case, the LED whose assigned value most closely corresponds to the resistance connected between the two probes will flash con-tinually 1t a steady pace, u|hile the other LEDs will seem to flash intermittently. (View)
View full Circuit Diagram | Comments | Reading(3851)
HARMONIC_DISTORTION_ANALYZER
Published:2009/6/17 3:52:00 Author:May
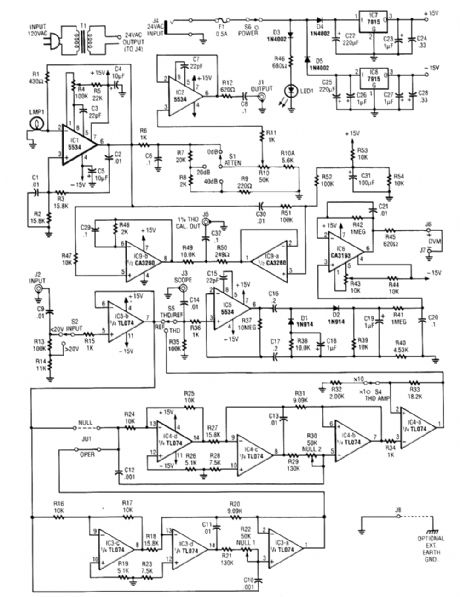
The circuit includes a low-distortion, 1-kHz oscillator and will measure THD at a user selected voltage level for voltage amplifiers, or for checking amplifiers of power levels to 600 W. It will detect THD levels of.005% (-86 dB). A built-in one-percent THD calibrator is included. The output device is a digital multimeter (DMM). (View)
View full Circuit Diagram | Comments | Reading(1673)
QUIZ_MASTER
Published:2009/6/17 3:46:00 Author:May
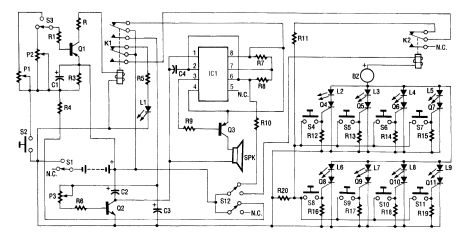
Up to eight players each have their own answer button to press, corresponding to the four Red Team and four Green Team LEDs on the master control board. As soon as the first contestant who thinks that he knows the answer presses the button, a loud tone sounds, all other contestants are locked out, and the contestant's indicator LED lights on the control board so that it's obvious who buzzed in first.
The control board also features two selectable time out periods-each adjustable from 3 to 15 seconds, setting specified time intervals in which the player must answer before the time's up! tone sounds. Eight SCRs form the heart of the circuit. The anode of each SCR has a positive (+) bias on it by way of an LED and a negative (-) bias on each cathode. As soon as a contestant depresses his or her switch button (S4 through S11), a positive bias is applied to the respective SCR gate. That bias latches the contestant's SCR on, which in tum lights up the appropriate LED on the master control board. At the same tirne, the activity of the SCR latching on turns on the answer buzzer (BZ) and locks out all other contestants. The lockout occurs because relay K2 contacts operate to remove the availability of a bias voltage to the gate of the other SCRs.
The other circuitry consists of a timer circuit and a time's-up tone-generating circuit. The timer circuit consists of transistor Q1, capacitor C1, resistors R1 through R3, and trimmer resistors P1 and P2. Depending on the adjustment of the trimmer resistors and selection switch S3, a specific time period can be set. The time's-up tone-generating circuit is made up of IC1, transistors Q2 and Q3, and the associated resistors and capacitors. The on time of the tone can be set by P3. Relay K1, which is operated by the timer circuit, serves to reset the entire unit for the next question. (View)
View full Circuit Diagram | Comments | Reading(2052)
ENERGY_CONSUMPTION_MONITOR
Published:2009/6/17 3:34:00 Author:May
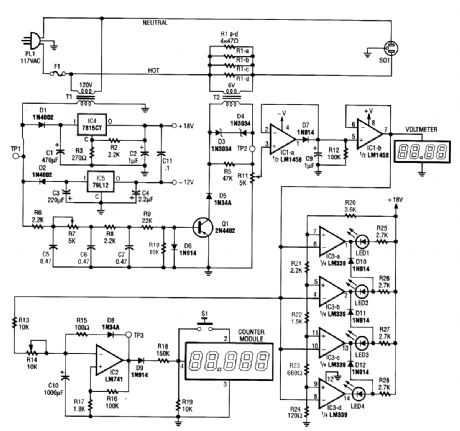
The EOM circuit consists of four sections, as shown in the block diagram. A power converter generates a voltage that is proportional to the true of real power consumed by the load. That voltage feeds both a bargraph and a voltage-to-pulse converter. The bargraph gives an approximate indication of the amount of power used, and the voltage-to-pulse converter produces a pulse whose frequency is proportional to the power. The pulse triggers the counter module, which displays the cost of powering the monitored load. (View)
View full Circuit Diagram | Comments | Reading(925)
POLAR_TO_RECTANGULAR_CONVERTER_AND_PATTERN_GENERATOR_FOR_RADIO_DIRECTION_FINDING
Published:2009/6/17 3:28:00 Author:May

In order to display polar quantities (magnitude and direction of a received radio signal), a sine and cosine voltage proportional to an angle (antenna direction) is needed. In this case, a sine-cosine potentiometer coupled to a directional antenna and a sample of a voltage proportional to received signal is used to display relative magnitude and direction of a received signal. (View)
View full Circuit Diagram | Comments | Reading(1934)
BARGRAPH_LED_BATTERY_TESTER
Published:2009/6/17 1:56:00 Author:May
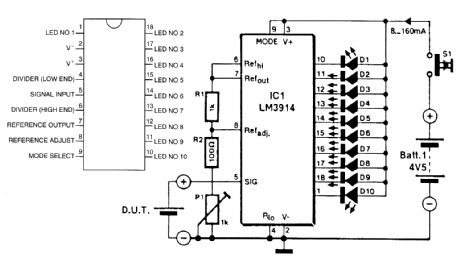
The LM3914A bargraph LED is used here as a voltmeter for battery testing. The circuit is pow-ered by a 4.5-V battery and compares the battery under test with an internally derived reference, set by R1/R2/P1. Each LED of the 10 represent 10% of full scale. For best results, the battery (D.U.T.) should be loaded with an appropriate resistor. (View)
View full Circuit Diagram | Comments | Reading(3170)
| Pages:84/101 At 2081828384858687888990919293949596979899100Under 20 |
Circuit Categories
power supply circuit
Amplifier Circuit
Basic Circuit
LED and Light Circuit
Sensor Circuit
Signal Processing
Electrical Equipment Circuit
Control Circuit
Remote Control Circuit
A/D-D/A Converter Circuit
Audio Circuit
Measuring and Test Circuit
Communication Circuit
Computer-Related Circuit
555 Circuit
Automotive Circuit
Repairing Circuit