
Measuring and Test Circuit
Index 36
SOUND_LEVEL_METER
Published:2009/7/16 4:44:00 Author:Jessie
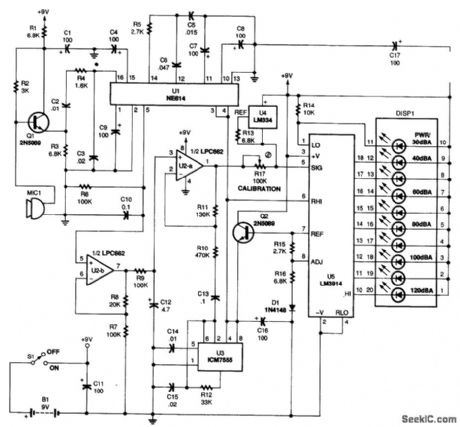
Power for the circuit is provided by B1, a 9-V battery. Total battery current is 14.5 mA, so an alkaline battery should last about 250 hours. Audio signals are picked up by microphone MIC1. The output of MIC1 is buffered by Q1 to maintain the 3000-Ω load of resistor R2. The input impedance at pin 16 of the NE614 (U1) is 1600Ω to reduce the gain on the high end and preserve the RSSI linearity. The RSSI signal is a current source that flows through R6 to establish a voltage at pin 5 of U1;the RSSI output voltage is a function of the input SPL. Capacitor C10 removes high-frequency components. The slope of the RSSI line is nominally 0.084VCC/10 dB. Op amp U2-b is configured as a non-inverting voltage buffer with a gain of 1.2; multiplied by the RSSI slope, this produces a slope of 0.1VCC/10 dB. The display, DISP1, is a 10-bar LED that is used to indicate sound level in 10-dB increments from 30 to 120 dB(A). The display is driven by an LM3914linear bar-graph driver, U5. The internal voltage regulator of U5 functions by establishing a constant current through R15 because the voltage between pins 7 and 8 is maintained at 1.25V. The resulting voltage at the emitter of Q2 is about 5V, which powers U1, U3, and the internal voltage-divider string of U5 at pin 6. Each segment of the display will increase by 10 dB, independent of the exact magnitude of VCC While the slopes of the display driver and the RSSI signal are the same, they might not have the sanit offset. For that reason, an LM334, U4, is used to source a constant 10-μA current through R17 to generate a fixed off-set voltage on top of the composite RSSI voltage at the output of U2-a. By adjusting the value of potentiometer R17, differences in microphone sensitivity can be accommodated so that the display reads properly from 30 to 120 dB(A). The proper readout of the display is also ensured by an ICM7555 timer, U3, which is configured as a self-excited square-wave oscillator; the resulting peak-Lo-peak, 1-kHz signal of the timer is almost one step size of DISP1. (View)
View full Circuit Diagram | Comments | Reading(0)
VOICE_STRESS_ANALYZER
Published:2009/7/16 4:31:00 Author:Jessie
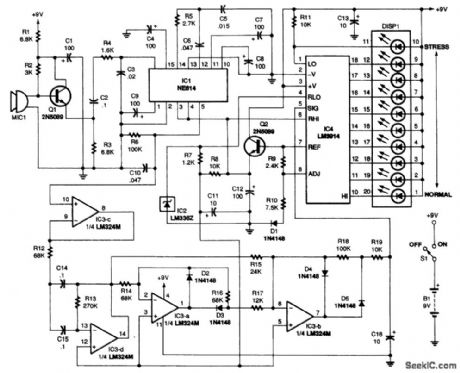
This circuit analyzes the 7-to 15-Hz voice-frequency components that are associated with the stressed voice that occurs if a person is lying or under duress of some kind. These components appear as an amplitude modulation on the voice and are thought to be inversely proportional to psychological stress. Their relative amplitudes are read out on a bar-graph display. (View)
View full Circuit Diagram | Comments | Reading(1780)
PROM_CONTROLLED_COUNTER
Published:2009/7/13 4:16:00 Author:May
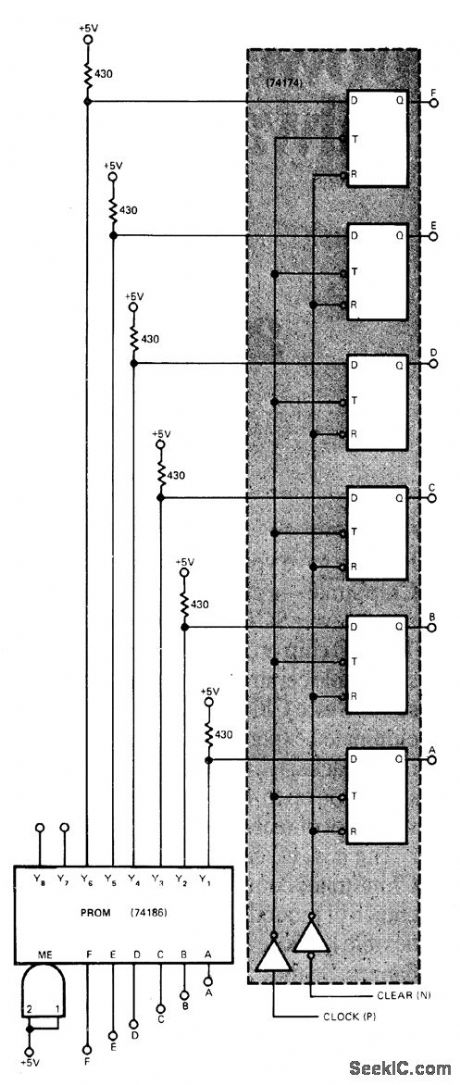
Universal counter can be set to count in any desired se-quence ranging from simple binary to pseudorandom, using only one programmable read-only memory chip and one 74174 edge-triggered flip-flop register chip, Version shown is 6-bit 64-state counter for which PROM is organized in 64 8-bit words. Pull-up resistors are required. Article covers application details, in-cluding expansion techniques. PR0M outputs serve as data input to register chip, and register outputs provide PR0M address inputs. -T. M. Farr, Jr., Read-only Memory Controls Universal Counter, EDN Magazine, May 5, 1976, p 114. (View)
View full Circuit Diagram | Comments | Reading(1078)
MULTIDIGIT_DEMONSTRATION_COUNTER
Published:2009/7/13 4:14:00 Author:May
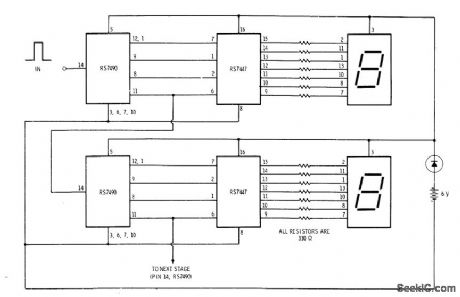
Simple interconnection of RS7490 decade counter、RS7447 decoder, and 7-segment digital display for each desired digit makes ideal counter for classroom demonstrations and Sci-ence Fair exhibits, With two additional stages added, display reaches 9999 before recycling. Use 1N914 diode in series with battery to protect against polarity reversal and reduce supply to 5 V for ICs.-F. M. Mims, Integrated Circuit Projects, vol. 6, Radio Shack, Fort Worth, TX, 1977, p53-63. (View)
View full Circuit Diagram | Comments | Reading(3614)
UP_DOWN_COUNTER
Published:2009/7/13 4:12:00 Author:May
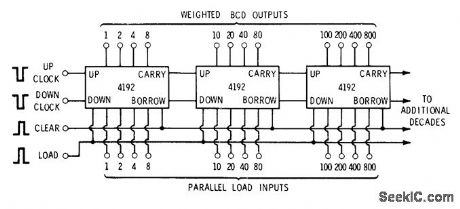
Cascading of 4192 de-cade up/down counters and use of two clocks give fully synchronous system for adding or subtracting count. Both clocks are normally held high. Low on up clock advances count. Low on down clock subtracts 1 from count. Clocking takes place on trailing or positive edge of neg-ative pulse. Parallel loading inputs are used to preset counter to any desired number. -D. Lan-caster, CMOS Cookbook, Howard W. Sams, Indianapolis, IN, 1977, p 309-310. (View)
View full Circuit Diagram | Comments | Reading(1577)
CASCADED_DOWN_COUNTER
Published:2009/7/13 4:12:00 Author:May
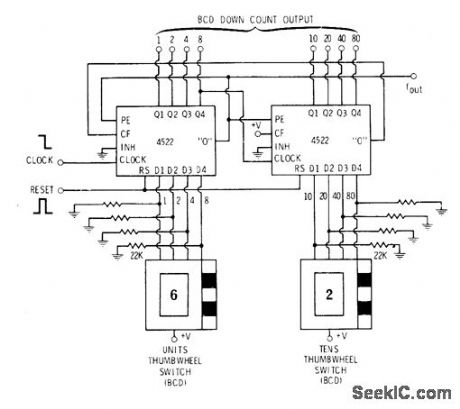
4522 decimal divide-by-N counter is used with BCD thumb-wheel switch for each decade. Output is in BCD format, going down from preset number in range of 0-99. Decoded 0 output of tens stage is connected to CF or carry-forward input of units stage. Only when both counters are in 0 state is 0 output provided. Preset number is then reloaded into counters. -D. Lancaster, CMOS Cookbook, Howard W. Sams, Indianapolis, IN, 1977, p 311-312.
(View)
View full Circuit Diagram | Comments | Reading(3897)
SELF_STARTING_COUNTER
Published:2009/7/13 4:09:00 Author:May
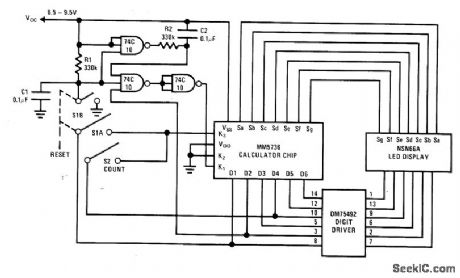
Addition of three Iogic elements eliminates need for separate starting switch when using National MM5736 calculator chip as counter driving LED display. When reset switch is returned to normal posi-tion after pushing it to clear calculator, addi-tional parts serve to generate delayed pulse that gates digit output 2 into calculator and thus enters a 1. This action resets counter with single manual operation. -M. Watts, Calculator Chip Makes a Counter, National Semiconductor, Santa Clara, CA, 1974, AN-112, p 4. (View)
View full Circuit Diagram | Comments | Reading(1496)
MAXIMUM_ACCELERATION_RECORDING_CIRCUIT
Published:2009/7/16 4:27:00 Author:Jessie
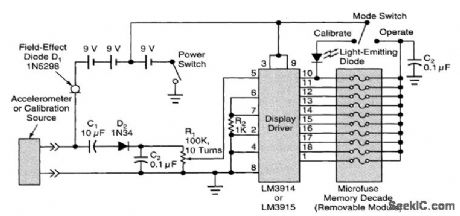
The circuit (see figure) includes three 9 V batteries,one of which supplies the 9 V needed by the circuit,and all of which supply the 27V needed by the accelerometer Power is supplied to the accelerometer through field-effect diode D1,which regulates the accelerometer current to keep it In the range of 2 to 4mA. The accelerometer puts out an ac signal that peaks at a full-scale value of 5V when the ac component of acceleration reaches 50g(where g denotes normal Earth gravitation)The acceleration signal is coupled through C1 and D2 into C2,which retains the peak value for a short time The signal is fed through potentiometer R1 to the input terminal(pin 5) of a 10-level display driver,LM3914,that has equally spaced levels,each representing 5g, or of a similar circuit,LM3915,that has logarithmically spaced levels,with each succeeding level representing division of the next higher level by a factor of √2 (3 dB/step) Depending on the level of the input signal,the display driver energizes one of its ten output lines,each of which IS connected to one of ten 2-mA transparent-cap microfuses plugged into a module,If the fuse on a lineis still intact,then when that line is energized,the driver delivers a current of 10 mA, blowing the fuse The fuses can be inspected visually or electrically at any convenient time thereafter to determine which (if any) has blown、thereby determining what level of acceleration was reached. (View)
View full Circuit Diagram | Comments | Reading(1164)
12_GHz_DECADE_COUNTER
Published:2009/7/13 4:08:00 Author:May
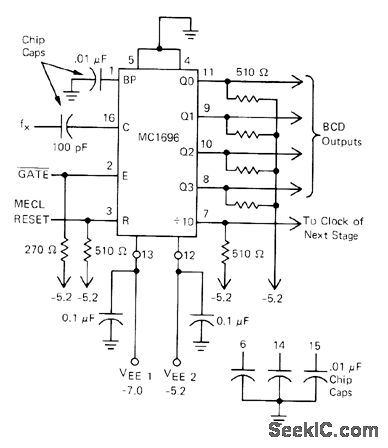


Motorola MC1696 BCD-output counter provides direct counting of events at up to 1.2 GHz without prescaling. Connection shown is for AC coupling of input signals. Decoupling capacitors are used on power supplies and all unused pins.MC1696 provides division by 10, with output driving cascaded MC10138 biquinary counters and associated latches connected to drive five-decade display as covered in report.-J, Roy, Event Counter and Storage Latches for High-Frequency, High-Resolution Counters, Moto-rola. Phoenix, AZ, 1975, EB-47.
(View)
View full Circuit Diagram | Comments | Reading(1216)
CARBON_MONOXIDE_DETECTOR
Published:2009/7/13 4:03:00 Author:May
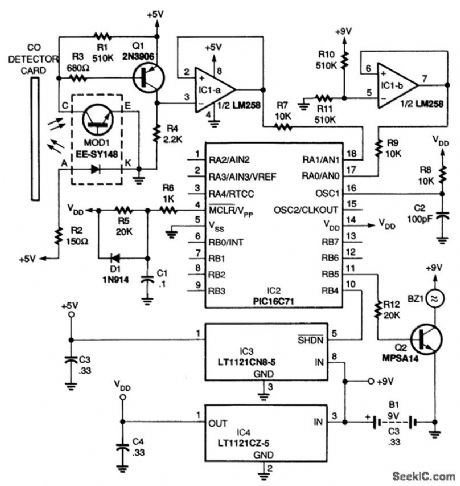
This circuit has a focused optical sensor to transmit light to the CO reagent, and then sense the amount of light reflected. The reagent for CO detection darkens from a light yellow color when exposed to CO. According to the card's manufacturer, a concentration as low as 100 parts per million (ppm) will darken the detector after 15 to 45 min. A concentration of 600 ppm will darken it in 1 to 2 min. The reagent will return to its original color when the air freshens, usually after about 10 min.The time it takes for the reagent to return to its original color depends on the concentration of CO to which it was exposed. The brain of the CO detector circuit is a PIC16C71 microcontroller (IC2) that contains a built-in four-channel analog-to-digital converter. Other than the microcontroller, the main component of this circuit is MOD1, an Omron BE-SY148 optical reflector module. The module directs infrared light to the CO reagent and then receives the light reflected back to it. When CO is present, the reagent will darken, thus reducing the reflectivity. The reduction is sensed by the microcontroller, which then turns on buzzer BZ1. (View)
View full Circuit Diagram | Comments | Reading(4164)
ENLARGER_TIMER
Published:2009/7/13 4:03:00 Author:May
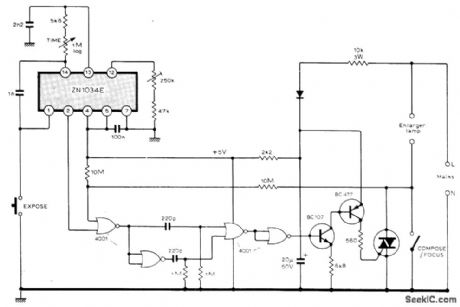
Requires no transformertype power supply because circuit operates from 1 mA taken from AC line through 10K resistor and rectifier. Ferranti ZN1034E timer IC generates delay and supplies 5 V for 4001 CMOS gates. Triac is tfiggered with 100-μs 60-mA pulses at zero-crossing point. Logarithmic timecontrol pot may be calibrated from 1 to 120 s.Choose triac tohandle current drawn by enlaigher lamp used.-M.J.Mayo,Transformerless Enlarger Timer,Wireless World,May 1978,p 68. (View)
View full Circuit Diagram | Comments | Reading(0)
AIR_CONDITIONER_MONITOR
Published:2009/7/13 4:01:00 Author:May
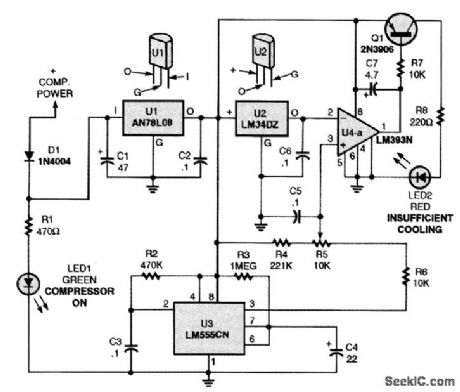
Power for the air conditioner monitor is derived from the + 12-V power lead that feeds the magnetic clutch of the air conditioning compressor. Thus, the circuit is active only when cooling is demanded of the A/C system. The heart of the circuit is U2, a factory-calibrated three-terminal temperature-sensing IC that is designed to deliver an output voltage of 10 mY per degree Fahrenheit. The sensor, which is driven by the regulated 8-V supply, is physically attached to the A/C evap-oratorcoil return pipe so that it accurately senses the operating temperature. Its temperature-dependent output voltage, which is proportional to the sensed temperature, is fed to negative input terminal U4-a (half of an LM393N voltage comparator) at pin 2. The output of U4-a can thus be used to determine the operating temperature of the evaporator return pipe. The positive input of the comparator allows the trigger voltage level of U4-a to be set slightly higher than the normal operating temperature of the A/C evaporator return pipe, or about 0.4 to 0.5 V, represent-ing 40 to 50°F.In order to avoid a false alarm caused by the warm evaporator return pipe each time the cycling A/C compressor starts, a time delay is provided by U3, a 555 oscillator/timer connected as a one-shot or monostable multivibrator that has an output pulse width of about 25 s as determined by R3 and C4. When compressor power is applied to the monitor, U3 is automatically triggered. Once triggered, U3 generates a positive output voltage at pin 3. That causes the open-collector output transistor within U4-a to be cut off. No base current flows to Q1, and LED 2 will not light. At the end of the timed cycle of U3, U4-a is ready to monitor the evaporator temperature. Should the temperature be above the limit set by R5, the output of U4-a is pulled low, illumi-nating the warning LED (LED2). As mentioned earlier, a warm evaporator return pipe is a symptom of loss of refrigerant or other problems with the air-conditioning system. Another light-emitting diode, LED1, has been included in the circuit as a visual indication as to the operation of the air conditioner compressor. Should the refrigerant charge be extremely low, the compressor will cycle rapidly, alerting the driver to an almost total loss of refrigerant. (View)
View full Circuit Diagram | Comments | Reading(2146)
DRAUGHT_DETECTOR
Published:2009/7/13 4:01:00 Author:May
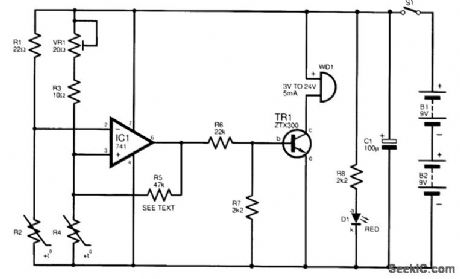
The complete circuit diagram for the draught detector is shown. The key components are R2 and R4; these form a pair of identical positive-temperature-coefficient (p.t.c.) thermistors. It is essential to use this particular type of thermistor. With switch S1 on, current flows from the nominal 18-V supply to the rest of the circuit. Thermistors R2 and R4 are included in a pair of potential dividers. The first comprises fixed resistor R1 in the upper arm and thermistor R2 in the lower one. The second consists of potentiometer VR1, connected in series with fixed resistor R3, in the upper arm and thermistor R4 in the lower one. With room temperature below 60℃, the current in the thermistors will be 150 mA approximately, sufficient for them to self-heat. They will then approach the threshold temperature within a few seconds. The thermistors will stabilize when the temperature reaches about 75℃, corresponding to a resistance of some 500 Ω. In the absence of a draught, each thermistor will be surrounded by a blanket of warm air. However, therrnistor R4 is arranged so that it does not receive any draught impinging on detector R2. When a draught is detected, the warm air around R2 is disturbed, and this thermistor is cooled slightly. This results in a lower resistance and hence a falling voltage being developed across it. This sounds the alarm. R5 supplies a little hysteresis to the alarm circuit. (View)
View full Circuit Diagram | Comments | Reading(1744)
LC_SELF_CALIBRATING_METER
Published:2009/7/16 4:15:00 Author:Jessie
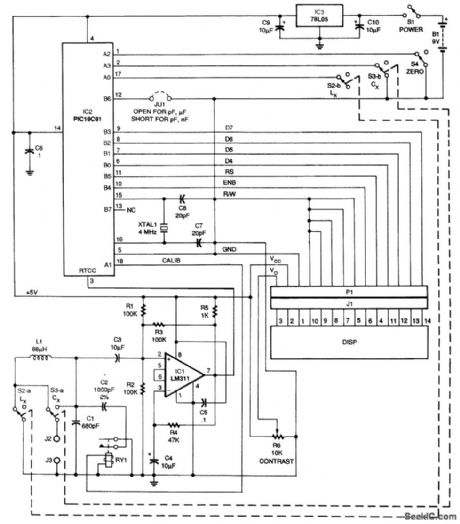
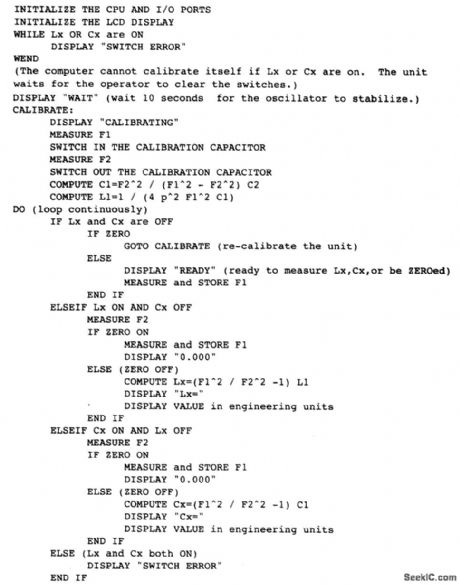
This circuit uses a microcontroller and a LED display,IC1 is an oscillator in which the unknown component is placed for measurement,and IC2 is a PIC16C61 microcontroller that calculates the unknown value and drives the LCD The microcontroller must be programmed;the program is given in listing 1. (View)
View full Circuit Diagram | Comments | Reading(1177)
NULL_DETECTOR
Published:2009/7/13 3:59:00 Author:May
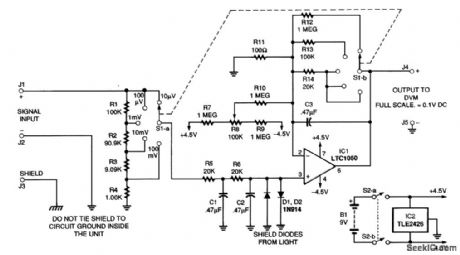
This null detector is based on the Linear Technology LTC1050 amplifier. Chopper stabilized, it provides performance that is almost driftfree. The low-frequency gain is guaranteed to be over 130 dB, so only one amplifier stage is needed. Input bias and offset currents are in the picoampere region, and, finally, the sample-and-hold capacitors have been incorporated within the amplifier, further simplifying the null detector's design. The circuit must be battery-powered, but no cells give reasonable positive and negative supply values. The answer lies in the TLE2426 rail splitter ground IC. Using this special divider/buffer, a standard 9-V battery will provide 4.5-V supplies-perfect for the CMOS chopper amplifier. The input of this detector is limited to a maximum of 100 mV. The most sensitive range is 10 μV, full scale. This allows the detector to resolve 1-μV differences with no difficulty The input impedance will be 200 kΩ for normal inrange signals,falling to a minimm of 40 kΩ under overload conditions The limiting factor is the voltage rating of the first input-filter capacitor,which runs at about one half of the input voltageunder overload conditions. (View)
View full Circuit Diagram | Comments | Reading(0)
TILT_SENSOR
Published:2009/7/16 4:09:00 Author:Jessie
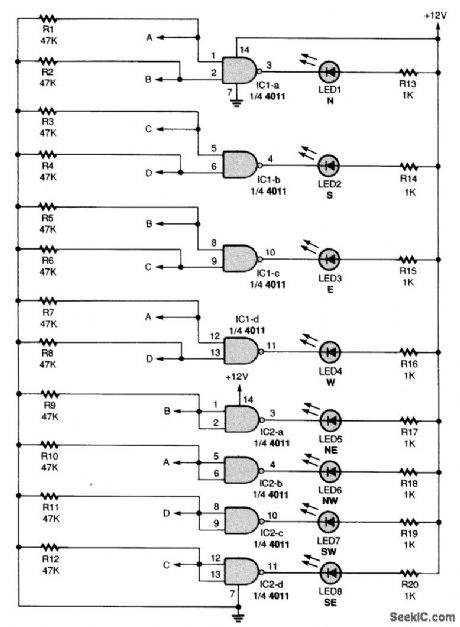
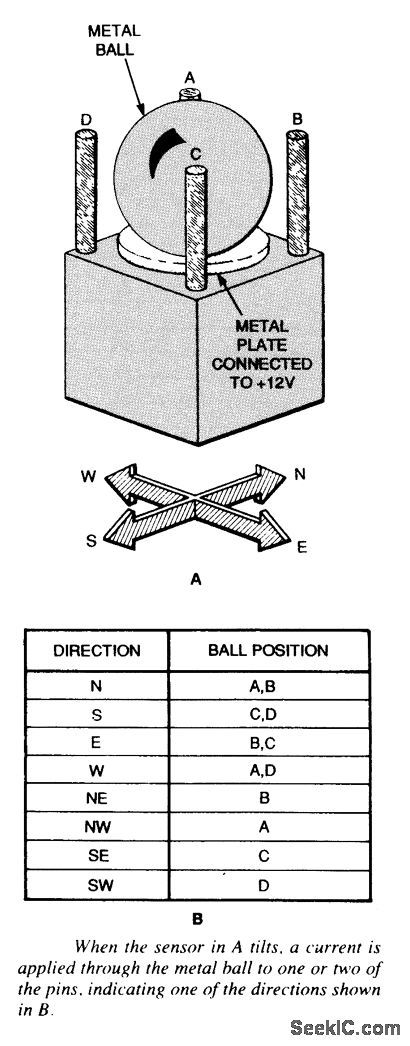
A metal ball sits on top of a metal plate that is mounted on an insulated stand. A metal pin is located at each corner. The metal plate is connected to + 12 V, and the four insulated pins go to the sensor's input circuitry. When the ball is centered (in a nontilt position), it does not contact any of the pins. No electrical connection is made between the ball and the pins. If the sensor tilts toward the north (as shown in the diagram) the ball will roll between pins A and B. That will complete an electric circuit, placing +12V on both those pins. The table shows which pins will be contacted when the sensor tilts in each direction. Pins A through D are connected to the inputs of several 4011 NAND gates (IC1 and IC2). When both inputs of one of the NAND gates go high, its output goes low, lighting the LED connected to it. Note that each of the IC2 gates has both its input pins tied together and to one directional pin to accommodate tilting in directions between the four cardinal points. For example, if the sensor tilts to the northwest position, the ball touches only the A pin. That means that IC2-b's output will go low, lighting LED6 (the northwest indicator). All other directions oper-ate in a similar manner. (View)
View full Circuit Diagram | Comments | Reading(1458)
LOW_LEVEL_EXPOSURE_METER
Published:2009/7/13 3:55:00 Author:May
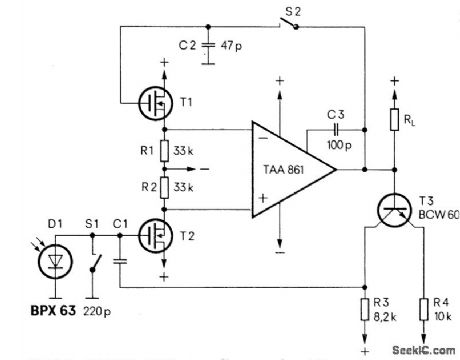
Uses Siemens BPX 63 photodiode having sensitivity of 10 nA per lux in circuit which ensures that apdrture setting is affected only by useful lightand not by noise signals. When used at low light levels, circuit recovers quickly from temporary light bursts. Switches S1 and S2 are closed when camera shutter is not open; opamp output is then connected to its inverting input through FET T1. At commencement of exposure, S1 and S2 open to give amplification of over 3000. Integrating capacitor C1 is then charged by photocurrent, making output voltage vary linearly with time. Base-emitter junction of T3 begins to conduct at output voltage of 1 V. Exposure is completed when C1 provides feedback via T3 so no cuwent flows through load resistor RL. Supply is ±3 V.- Photodiode BPX 63-All It Needs Is Starlight, Siemens, Iselin,NJ. (View)
View full Circuit Diagram | Comments | Reading(1869)
PEAK_DETECTOR
Published:2009/7/13 3:54:00 Author:May
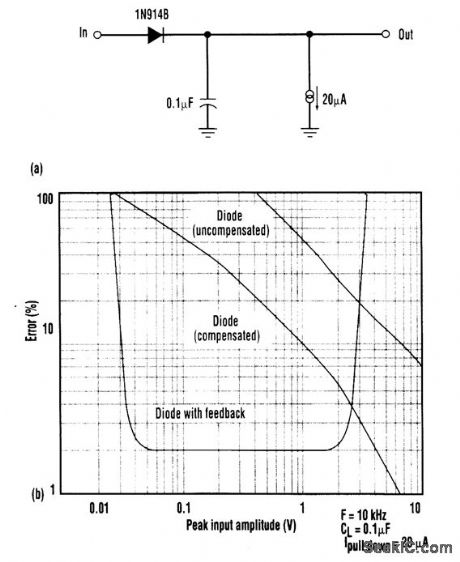
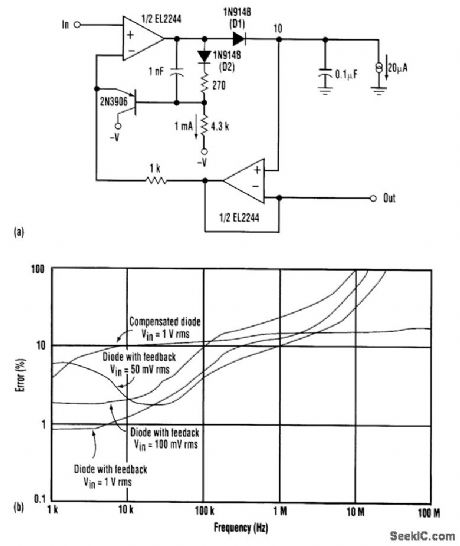
A simple peak detector, in its most common configuration, provides a mediocre 10 percent error for very large input voltages (a). If the diode is linearized, the necessary input voltage is only reduced to 1 V peak for the same 10 percent error (b).Feedback circuitry can provide better accuracy and more sensitivity at the input. Feedback makes possible peak detection at input voltages as small as 50 mV rms (a). If 5 percent errors can be tolerated, the circuit has a bandwidth of 100 kHz (b). (View)
View full Circuit Diagram | Comments | Reading(0)
RF_SIGNAL_STRENGTH_INDICATOR
Published:2009/7/16 4:06:00 Author:Jessie

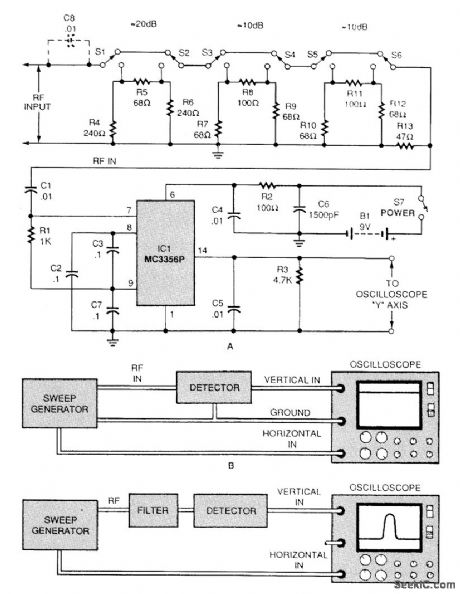
This circuit is useful for test purposes because it produces an output that varies logarithmically with RE input level. A Motorola MC3356 IC is used for its received signal strength output (pin 14), the other functions remain unused. An attenuator is placed at the input of the circuit to increase usable range. For best results, the circuit should be enclosed in a metal shielded box. (View)
View full Circuit Diagram | Comments | Reading(1151)
VIBRATION_DETECTOR
Published:2009/7/13 3:53:00 Author:May
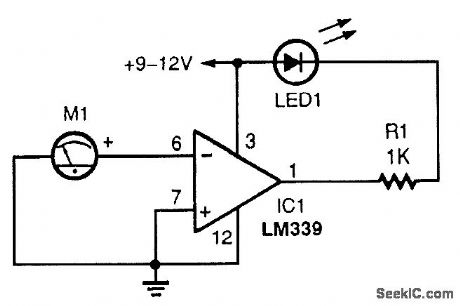
A D'Arsonval meter movement is used as a vibration detector in this novel application. The meter acts as a generator, producing a voltage when the needle moves. An inexpensive panel meter can be used, but a high-sensitivity movement (50 μA) works best. (View)
View full Circuit Diagram | Comments | Reading(0)
| Pages:36/101 At 202122232425262728293031323334353637383940Under 20 |
Circuit Categories
power supply circuit
Amplifier Circuit
Basic Circuit
LED and Light Circuit
Sensor Circuit
Signal Processing
Electrical Equipment Circuit
Control Circuit
Remote Control Circuit
A/D-D/A Converter Circuit
Audio Circuit
Measuring and Test Circuit
Communication Circuit
Computer-Related Circuit
555 Circuit
Automotive Circuit
Repairing Circuit