
Measuring and Test Circuit
Index 34
KELVIN_CONNECTION
Published:2009/7/16 2:28:00 Author:Jessie
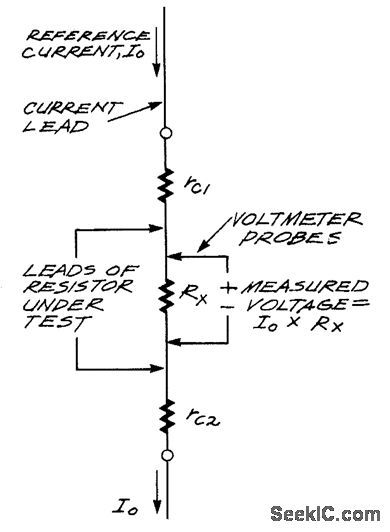
For low-resistance measurements, contact and test lead resistance introduce errors. This figure shows the way to avoid these. Current is applied through test leads, but separate leads are used to read voltage drop. (View)
View full Circuit Diagram | Comments | Reading(1134)
MILLIOHM_DMM_ASAPTER
Published:2009/7/16 2:26:00 Author:Jessie
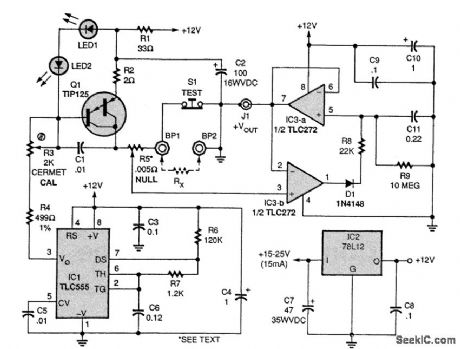
The circuit provides a 1.000-A constant-current pulse of 100-μs duration, at a 100-Hz repetition rate, to the unknown (RX) resistance, and provides an output voltage to your DMM of 1.000V per ohm of input resistance. Accuracy is better than ±1 percent up to 5.00 Ω, and the resolution using a 31/2-digit DMM is 100 μΩ. Extremely low resistance readings are limited only by the quality of the mechanical connections to RX, and the accuracy of the NULL setting. IC1 (a TLC555) provides the pulse timing to TIP125 transistor Q1, which is configured as a capacitive discharge current source. Capacitor CZ provides the current through R2, a stable metal-film or wire-wound resistor. Two red LEDs, LED1 and LED2, are selected to have a forward voltage drop of about 1.75V each (3.50V total) at a current range of 4 to 15mA, as provided in the circuit. Transistor Q1 has a dynamic Vbe of about 1.50 V, so the LEDs provide a 2.00-V reference across R2 with some temperature compensation. Integrated circuit IC3 (a TLC272) is configured as a peak detector. The 78L12 provides a regulated 12V to the circuit. The Rx, terminals, BP1 and BP2, must be heavy-duty binding posts; do not use test leads because that will introduce errors greater than the value of Rx. Resistor R5, the 0.005-Ω trimmer potentiometer, is simply a 2 1/2-in length of tinned, 24-gauge busbar wire, with the lead from pin 3 of IC3 terminated in a clip that will slide on the busbar. To calibrate the circuit, first use a heavy shorting bar between the input terminals, push S1 (TEST), and adjust R5 (NULL) for an output of 1.00 mV, or whatever value is convenient. You will have to subtract that NULL value from the actual readings. Next, replace the shorting bar with an accurate resistance, such as two 10.00-0, 1-percent resistors in parallel, and adjust R3 for the proper output (5.000 V). (View)
View full Circuit Diagram | Comments | Reading(2916)
CAPACITOR_LEAKAGE_TESTER
Published:2009/7/16 1:57:00 Author:Jessie
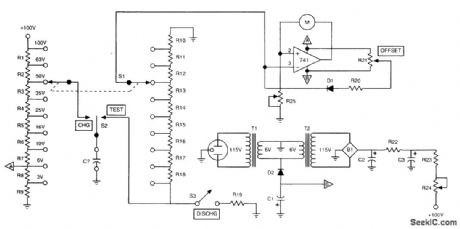
In this circuit, a capacitor is charged to a voltage near its working voltage, as selected by S1. Then S2 is placed in the TEST position, and high-resistance divider R10 to R18 is used to discharge it. The total resistance is 100 MΩ. Taps selected by S1 are used to reduce the voltage seen by the op-amp metering circuit to an appropriate value (around 3V). The discharge curve is watched on the meter. If it is too rapid, the capacitor might be leaky. This technique is useful for values of C that produce a sufficiently large time constant, 10s or more (C>0.1 μF). (View)
View full Circuit Diagram | Comments | Reading(3365)
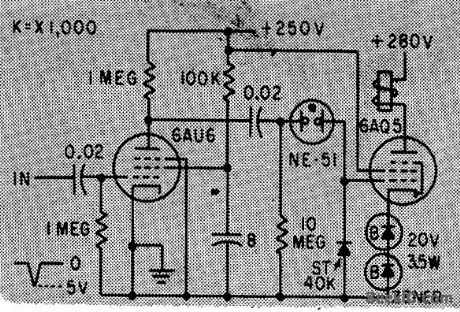
CONVEYOR_COUNTER
Published:2009/7/13 21:13:00 Author:May

Senses objects as small as 0.2 sq cm on moving conveyor at speeds up to 25 pps. -G. Jeynes, Using Cold Cathode Tubes to Count and Store, Electronics,38:8, p80-89.
(View)
View full Circuit Diagram | Comments | Reading(875)
SPEED_TRIPLING_COUNTER_DRIVE
Published:2009/7/13 20:51:00 Author:May
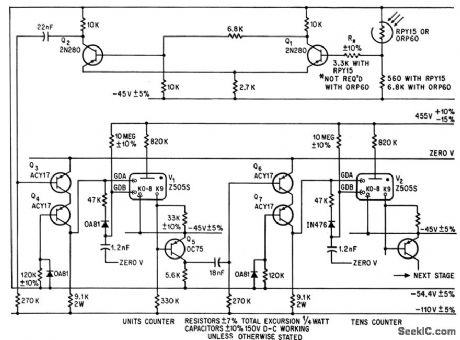
Increased speed of 25-cps electromechanical counter to 75 cps without affecting accuracy of count.Circuit circuit arrangement simplifies power supply requirements. Zener diodes eliminate need for bias supply.-R.L.lves, Circuit Modifications for Boosting Counter Speed, Electronics, 33:7, p112-114. (View)
View full Circuit Diagram | Comments | Reading(956)
FREQUENCY_METER
Published:2009/7/16 3:22:00 Author:Jessie
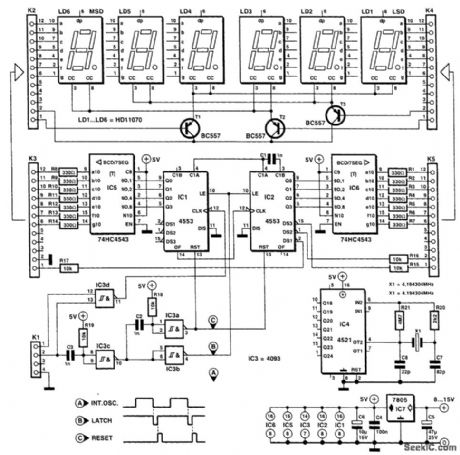
The counter makes use of two 3-digit DCD counters that have a multiplexed output with buffer memory and a RESET input. The multiplexed output signal is converted by an integrated BCD-to-seven-segment converter and then applied to an LED display. The necessary clock signal is generated by a crystal of 4.194304 MHz and a counter that divides the signal by 223. The result is a stable digital signal with a frequency of 0.5 Hz. The time during which the clock signal is high, and measurements can occur, is exactly 1 s. Owing to this arrangement, a new measuring value is displayed every 2 s. If the meter is used to measure frequency, the internal clock signal at pin 3 of K1 must be linked to pin 2 of K1. Gate IC3d then operates as a lock; every time the clock is high, the measurand at pin 1 of K1 is applied to the clock input of IC1. This circuit is connected in series with IC2 to form a six-digit counter. At the end of the measurement, a latch pulse is generated at the output of IC3c with the aid of R19 and C3. After this signal has been inverted in IC3b, it is applied to the LATCH in-put of IC1 and IC2. At the command of this signal, the current counter state is stored in the buffer memory. At the end of the LATCH pulse, network R18-C2-IC3a generates a RESET pulse with which the counter is reset. In the circuit as shown, the counter can be used for signals with frequencies from 1 Hz to 1 MHz. If higher frequencies are envisaged, the measurement time must be adapted accordingly. There are limits to this, though: With a supply voltage of 5V, the 4553 can be used for frequencies up to 1.5 MHz; with 7V, up to 5 MHz; and with 15V, up to 7 MHz. Still higher frequencies require the use of a prescaler. The current drawn by the circuit (as shown) does not exceed 50 mA, which makes a battery supply feasible. (View)
View full Circuit Diagram | Comments | Reading(0)
555_ASTABLE_FREQUENCY_METER
Published:2009/7/16 3:16:00 Author:Jessie
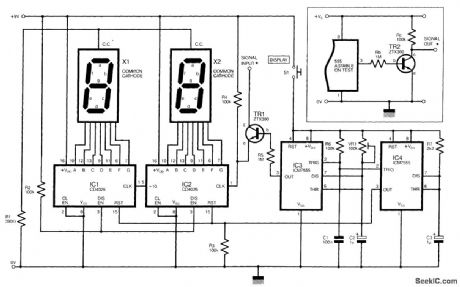
The circuit shown is a simple digital frequency meter, which indicates the frequency in hertz of an astable 555 timer. It could, perhaps, be adapted for other uses. An NPN transistor, TR2, is connected to the 555 astable to be measured, as shown in the in-set, and the output signal obtained is hooked to the main circuit via transistor TR1 collector (c). Two CMOS 7555 timers, IC3 and IC4,are wired as monostables, and these will trigger via R6 and C1 when the DISPLAY swith S1 is closed. The period of IC3 is adjustable using VR1.while IC4 times for a fraction of a second. When S1 is closed,IC4 sends a RESET signal to IC1 and IC2.which are two decade counters. each driving a seven-segment common-cathode LED display directly. IC3,the first decade counter. Monostable IC3 needs to be trimmed so that it triggers for approximately 100ms.Pressing switch S1 then allows 100ms'worth of pulses to clock up on the display, and simply multiplying the result by 10 will yield the value in hertz. It would be feasible to cascade several counters to show a higher range of frequencies. (View)
View full Circuit Diagram | Comments | Reading(10660)
DC_AMMETER_II
Published:2009/7/16 3:03:00 Author:Jessie
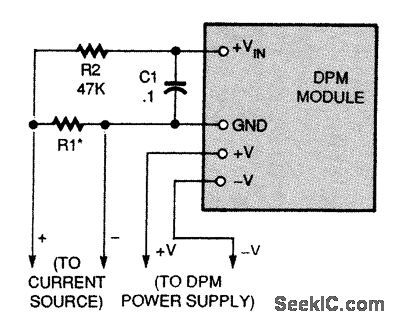
As shown here, a DPM module can be used as a dc ammeter.
R1 is chosen to provide a voltage drop so that the meter reads full scale at the maximum desired current reading. This drop should be kept as small as possible. Typically, it will be 100 to 200 mV dc. (View)
View full Circuit Diagram | Comments | Reading(1138)
DC_AMMETER_I
Published:2009/7/16 3:01:00 Author:Jessie
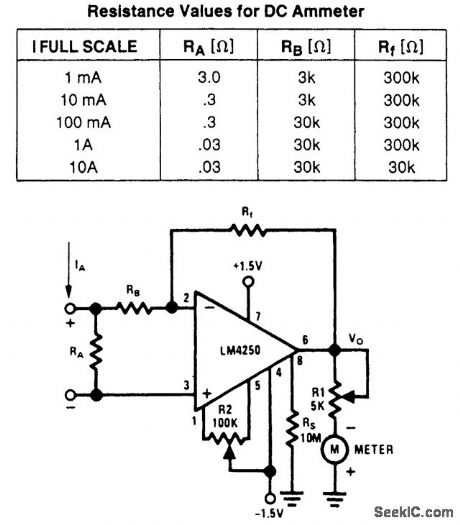
For dc readings higher than 100μA, the inverting amplifier configuration shown in the figure provides the required gain. Resistor RA develops a voltage drop in response to input current IA, This voltage is amplified by a factor equal to the ratio of RF/RB, RB must be sufficiently larger than RA, so as not to load the input signal. The figure also shows the proper values of RA, RB, and Rf for full-scale Deter deflections from 1 mA to 10 A. (View)
View full Circuit Diagram | Comments | Reading(1231)
LED_CURRENT_INDICATOR_CIRCUITS
Published:2009/7/16 2:56:00 Author:Jessie
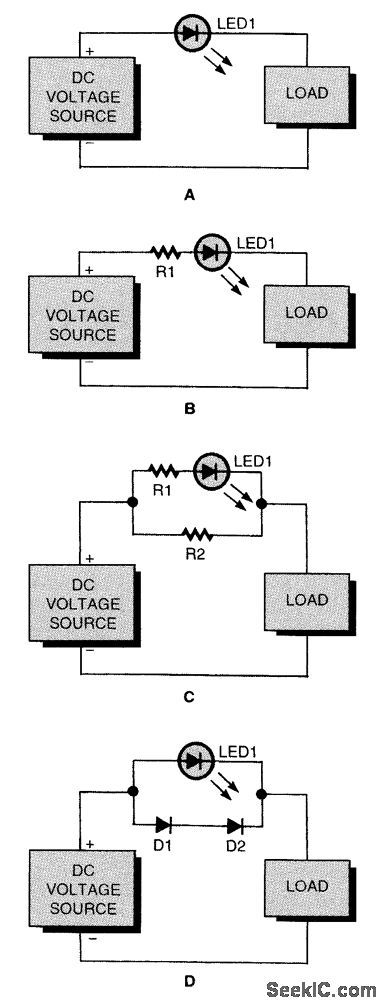
Here are some ways to connect an LED as an indicator that a load is receiving current: with the LED alone (A), with a resistor in series (B), with a resistor in series and one in parallel (C), and with two diodes in parallel (D). (View)
View full Circuit Diagram | Comments | Reading(983)
CURRENT_SOURCE
Published:2009/7/16 2:54:00 Author:Jessie

The figure shows the circuit of the milliohm adapter. It can apply 1A, 100 mA, or 10 mA to the resistance under test. The current application will indicate the resistance directly in millivolts if your voltmeter is set on the 2-V range. B1 is the high-current source, an alkaline battery capable of generating the 1 A used in the circuit's highest-current application mode. This must be an alkaline battery. A three-position switch enables user selection of the desired applied current to the DUT. S1 performs as a dual-function on/off switch. When a measurement is to be made, pressing S1 turns on the circuit, which consists of a micropower voltage reference chip IC1 and an op amp, IC2. 101's out-put is 2.500 V, and that voltage is divided by R1 and R2, producing 0.1Vat the input of IC2. This turns on Q1, creating a 0.1-V potential at its source terminal. The resistive divider (R4, R5, and R6) forms a current source along with Q1, the 1.5-V battery and the DUT's resistance. That is applied to the DUT through the two output terminals, T1 and T2. When you connect your voltmeter across these terminals, you can directly read the resistance of the DUT. An optional LED shows when the circuit is in test mode. The 1-A range of the instrument will drain the 1.5-V alkaline battery faster than the 9-V battery, so it is advisable for reasons of economy not to keep S1 depressed for protracted periods on that range, or else the battery- life will suffer. Releasing S1 will halt the current source through Q1 and the associated circuit path, and thus will shut off the current flow from the 1.5-volt battery. The same effect will occur if you disconnect the test leads. (View)
View full Circuit Diagram | Comments | Reading(0)
MAGNETIC_FIELD_METER_
Published:2009/7/13 6:05:00 Author:May
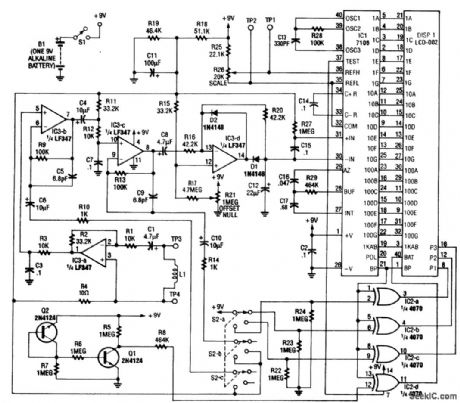
The meter's 12-turn field pickup is integrated into the unit's circuit board. For remote sensing, an external field coil probe can be used. The magnetic field picked up by the coil appears as a voltage, which is proportional to field strength and frequency at the input of a cascaded amplifier IC3-a, IC3-b, and IC3-c. With a first-stage amplifier gain of 3.3 set by R12 to R10, the overall sensitivity is 100 μV/μT, or 100 mV/mT. The meter sensitivity is nominally 2 V full scale, leading to the lowestlevel sensitivity of 20 mT full scale. Op amp IC3-a amplifies the signal to a normalized level of 100 μV/μT. The voltage is further amplified by 1, 100, or 10,000 by IC3-b and IC3-c. The three amplifier stages provide the ranges of 2 mT,200 μT, and 2 μT (full scale). Components R3 and C3 and R12 and C7 establish a frequency rolloff characteristic that compensates for the frequency-proportional sensitivity of the pickup coil, and set the 20-kHz cutoff point. IC3-d is a precision rectifier and peak detector. Its output drives IC1, a combination analog-to-digital (A/D) converter and LCD driver. Components R25 to R29 and C13 to C17 are used by IC1 to set display-update times, clock generation, and reference voltages. The decimal points are driven by IC2, as determined by range-select switch S2. Transistors Q1 and Q2 serve as a low-batterydetector, and turn on the battery annunciator in the LCD when the battery voltage drops below 7 V. (View)
View full Circuit Diagram | Comments | Reading(2534)
INTEGRATING_CURRENT_METER_CIRCUIT
Published:2009/7/16 2:50:00 Author:Jessie
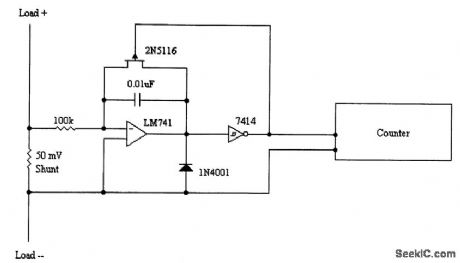
The current in the line produces a dc drop across the shunt, which feeds an integrator. When the integrator output reaches the level required to activate the Schmitt trigger, the 0.01-μF capacitor that is used in the integrator is discharged and a pulse is produced at the output of the Schmitt trigger (7414). A digital counter counts these pulses, and the counter reading is proportional to the product of current flow and time. (View)
View full Circuit Diagram | Comments | Reading(1777)
AMPLIFIED_FIELD_STRENGTH_METER
Published:2009/7/13 5:44:00 Author:May
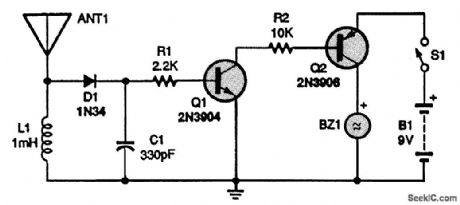
This field-strength meter uses Q1 and Q2 to amplify the dc voltage produced by detector D1. A piezo sound BZ1 is used as an audible indicator, rather than using a meter. This circuit could be of use for the visually handicapped. The antenna is a 24-in whip. (View)
View full Circuit Diagram | Comments | Reading(0)
PICOAMPERE_MEASURER
Published:2009/7/16 2:48:00 Author:Jessie
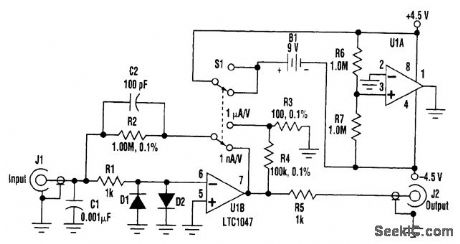
Many times, the need arises to measure current below 1 μA. The circuit shown turns any voltmeter into a picoammeter with scales of 1 μA/V and 1 μA/V. With a 3 1/2-digit voltmeter with a resolution of 1 mV, the readout will be in picoamperes or nanoamperes. In addition, it can be attached to an oscilloscope. The frequency response is about 1 kHz for the 1 μA/V setting and 150 Hz for 1 μA/V.U1B forms a transimpedance amplifier. With S1 in the position shown, the transimpedance is 1MΩ.In the other position, a gain of 1000 is added, to make the total transimpedance 1GΩ. R1, C1, D1, and D2 protect the input from high voltages, and R5 isolates the op amp's output from any load capacitance. The op amp's input current and voltage offset must be low for this circuit to work. In this case, a Linear Technology LTC1047 was used. It has a nominal input bias current of ±5 pA and a V0S of ±3μV at room temperature. U1A is used to split the 9-V battery into positive and negative supplies. The total current is essentially the supply current of the op amps. For the prototype, the total current measured for the LTC1047 was <100 μA, so a standard 9-V battery should last six months if you forget to turn it off. (View)
View full Circuit Diagram | Comments | Reading(4032)
LOW_RANGE_OHMMETER
Published:2009/7/16 2:42:00 Author:Jessie
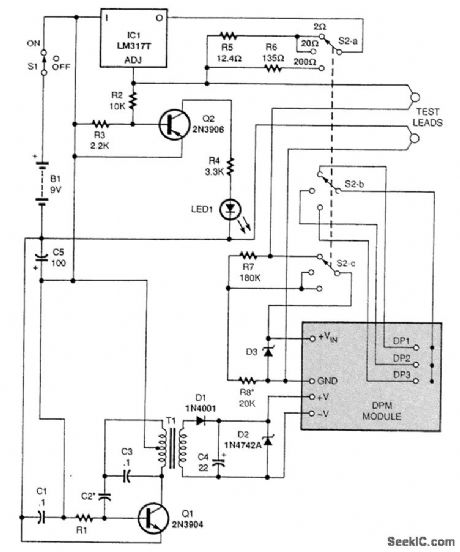
This direct-reading self-contained low-ohms meter uses the four-wire, constant-current method of resistance measurement. That eliminates any effect of test-lead resistance on measurements.
T1 is a 1:1 audio transformer, 600:600Ω. D3 is an optional Zener diode to protect the digital panel meter module DPM from excessive input voltage. The lowest reading for this circuit is 1mΩ. (View)
View full Circuit Diagram | Comments | Reading(2408)
HEADLIGHT_MONITOR
Published:2009/7/13 5:20:00 Author:May

With this simple circuit, you'll never again forget to turn your headlights on. (View)
View full Circuit Diagram | Comments | Reading(911)
MILLIOHM_TESTER
Published:2009/7/16 2:40:00 Author:Jessie
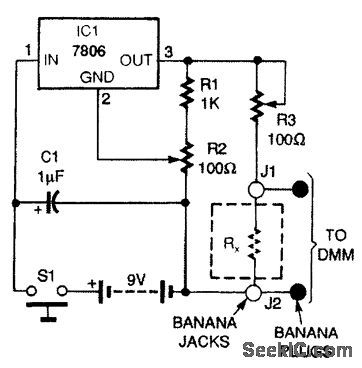
The milliohm adapter circuit is powered from a 9-V battery. A resistor to be tested (RX) is connected across banana jacks J1 and J2, and a pair of banana plugs, connected directly to J1 and J2, is plugged into the voltage input jacks of a DMM. Switch S1 applies battery power to 7806 voltage regulator IC1. Capacitor C1 removes voltage transients. Resistors R1 and R2 form a voltage divider for the GROUND pin of IC1. Potentiometer R2 trims IC1's output voltage to exactly 6 Vdc. Potentiometer R3 sets the output current through RX, to 100mA. Because R3 is a relatively large resistance compared to RX, the error introduced by different values of RX, (1 mΩ to 1Ω), the effect it will have on the 100-mA current source, is below 2 percent. (View)
View full Circuit Diagram | Comments | Reading(3473)
MAGNETIC_FIELD_DETECTOR
Published:2009/7/13 5:19:00 Author:May

A relay coil makes a great magnetic-field detector. (View)
View full Circuit Diagram | Comments | Reading(2400)
EARTH’s_FIELD_DETECTOR
Published:2009/7/13 5:18:00 Author:May
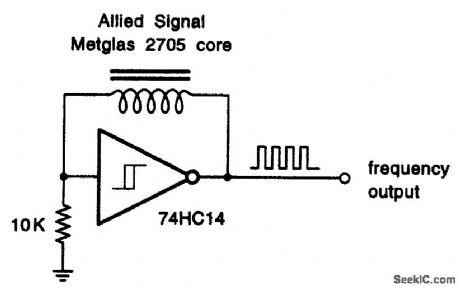
This elegantly simple earth's field detector uses a special variable permeability cored coil. The output frequency varies with orientation. (View)
View full Circuit Diagram | Comments | Reading(1177)
| Pages:34/101 At 202122232425262728293031323334353637383940Under 20 |
Circuit Categories
power supply circuit
Amplifier Circuit
Basic Circuit
LED and Light Circuit
Sensor Circuit
Signal Processing
Electrical Equipment Circuit
Control Circuit
Remote Control Circuit
A/D-D/A Converter Circuit
Audio Circuit
Measuring and Test Circuit
Communication Circuit
Computer-Related Circuit
555 Circuit
Automotive Circuit
Repairing Circuit